Environmental Engineering Reference
In-Depth Information
1
0.9
0.8
0.7
H
2
(g)
CH
4
(g)
N
2
(g)
O
2
(g)
H
2
O(g)
CO(g)
CO
2
(g)
C(s)
0.6
0.5
0.4
0.3
0.2
0.1
0
0
0.1
0.2
0.3
0.4
0.5
0.6
0.7
0.8
0.9
1
Stoichiometric oxygen ratio
λ
(
−
)
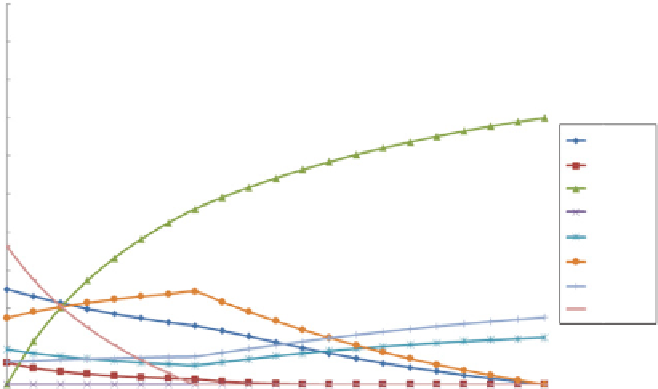
FIGURE 10.3
Chemical equilibrium for gasification of dry wood at T = 850
C and
p
=
2.0 MPa.
value of the highest CGE (see, e.g., Prins et al. (2003)). Regarding the graphs, below
the carbon boundaries
0.35 for
p
= 2.0 MPa, CC is
not complete anymore, which can be seen from the increased values of solid
C predicted. This therefore leads to an optimum in the amount of energy in the gas
compared to the thermal energy input.
−
λ
0.2 for
p
= 0.1 MPa and
λ
10.1.5 Kinetic and Mass Transfer Aspects of Biomass Gasification
1000
C without the presence of spe-
cies in the reactor that (significantly) act as catalysts, usually chemical equilibrium
is not attained, because practical residence times, in particular of the gas phase, are
too short. In particular, the deviation from equilibrium appears from substantially
higher hydrocarbon species concentrations (methane, light olefins, aromatic com-
pounds) than predicted. Also, nitrogen compounds such as ammonia (NH
3
)and
HCN are present in the gas in significant amounts, despite the fact that they are
not found to such extent in chemical equilibrium calculations, as N
2
is more stable
(De Jong, 2005; Leppälahti and Kurkela, 1991). In order to be able to more accu-
rately predict gas yields and composition, a reactor model based on finite kinetic
rates of the most important gasification reactions is needed for more detailed
reactor and process design.
The subprocesses taking place during biomass gasification are drying (dealt with in
Chapter 8), pyrolysis (see Chapters 2 and 11), char oxidation (a combustion process
For gasification at temperatures lower than


Search WWH ::

Custom Search