Environmental Engineering Reference
In-Depth Information
(a)
Global average surface temperature
0.5
14.5
0.0
14.0
-0.5
13.5
(b)
Global average sea level
50
0
-50
-100
-150
(c)
Northern hemisphere snow cover
4
40
0
36
-4
32
1850
1900
1950
2000
Year
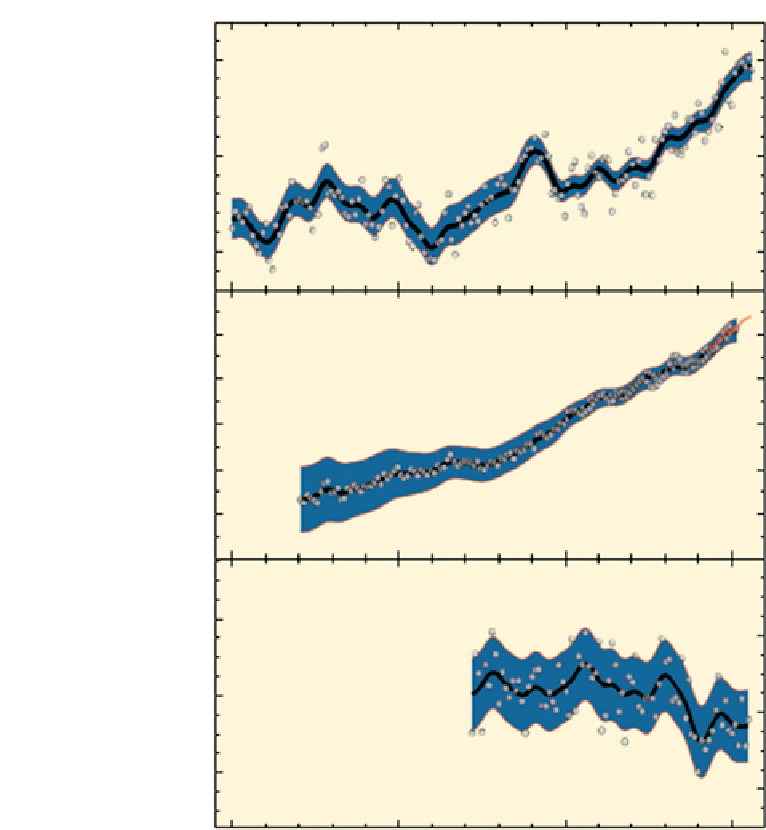
FIGURE 1.4
Observed changes in (a) global average surface temperature, (b) global average
sea level from tide gauge (light grey circles; blue circles in the original publication) and satellite
(light grey line through the data points and extending from early nineties to beyond the year
2000; red line in the original publication) data, and (c) northern hemisphere snow cover for
March and April. All differences are relative to corresponding averages for the period
1961-1990. Smoothed curves represent decadal averaged values, while circles show yearly
values. The shaded areas are the uncertainty intervals estimated from a comprehensive
analysis of known uncertainties (a) and (b) and from the time series (c).
(Source:
Reproduced with permission from IPCC (2007), figure 1.1; figure SPM.3. © IPCC.)


Search WWH ::

Custom Search