Environmental Engineering Reference
In-Depth Information
9.9
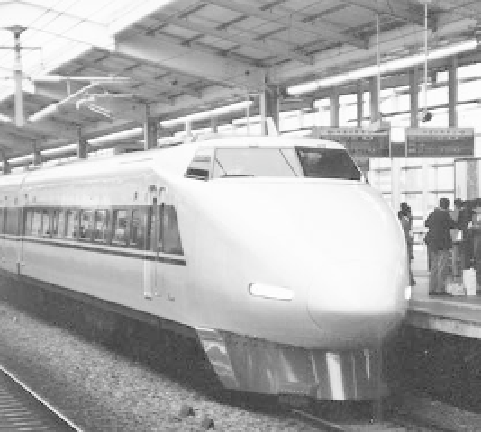
(a) Japanese nozomi shinkansen.(b) French TGV Sud.
From Smil (2006).
sities of 150-200 W/m
2
of road, assuming an average
rate of 13 L/100 km. Short-term rates limited to smaller
areas during rush-hour periods or extensive traffic jams
can surpass 250-300 W/m
2
. These rates are more
revealing (because of their contribution to the urban
heat island) than any long-term, large-scale averages that
are composed of extended periods of no or minimal traf-
fic as well as daily and seasonal peaks of extraordinary
intensity. Climate, building heights, concentration, and
specific performance of commercial buildings and the
typical density of traffic combine to produce an order of
magnitude range for consumption power densities of ur-
ban central business districts (CBDs). Low-profile and
low-density downtowns in smaller cities in mild climates,
with buildings only a few stories high and lightly traveled
roads, average no more than 100 W/m
2
, and extensive
parking and greenery can bring this down to below 50
W/m
2
of the entire area. In contrast, high-rise (average
20 stories), high-density (75% built-up area) CBDs in
large cities in cold mid-latitudes will rate, with heavy traf-
fic, over 500 W/m
2
with peaks in excess of 700 W/m
2
.
Sectoral changes of final energy uses have shifted the
dominant demand decisions from industries and govern-
ments to individuals. At the end of the twentieth century
the combined share of energy use by the residential sec-
tor and by private transportation was less than 15% of
China's TPES, surpassed 20% in Japan, and approached
45% in the United States. Consequently, in such low-
income, rapidly industrializing countries as China, where
household energy use is frugal and car ownership still
very limited, decisions about using some 85% of TPES
are in the hands of the state and businesses. In contrast,