Environmental Engineering Reference
In-Depth Information
largest producers (United States, China, Russia, Saudi
Arabia, and Canada) accounted for 51% of the world's
output of coals, oils, and gases. The aggregate growth of
global energy output has been accompanied by a univer-
sal transition toward higher-quality fuels, from coal to
hydrocarbons. Oils and gases were a marginal part of
the total output until the first decade of twentieth cen-
tury. Their heat content surpassed coal's contribution by
1960, and they have been providing more than two-
thirds of all fossil energies since 1970 (the 2005 share
was about 70%). The extraction of natural gas has been
rising much faster than the production of crude oil, and
by 2005 gases accounted for just over one-quarter of all
fossil energies.
For many decades these energy transitions appeared to
follow a remarkably orderly, predictable course. Mar-
chetti (1977) found that full cycles of shares of TPES
delivered by individual energy sources approximate nor-
mal Gauss-Laplace curves. The pattern looks particularly
impressive when market shares (f ) of primary commer-
cial energy consumption are plotted as logarithms of
f
=
ð
1
f
Þ
; the ascents and descents then appear as
straight lines (fig. 9.2). The process is very slow, with
every new source taking about a century to penetrate
half the market share, and for decades it was surprisingly
regular. Despite wars and periods of economic stagnation
and rapid growth, penetration rates remained constant
during the first three-quarters of the twentieth century.
That is why Marchetti and Naki
´
enovi
´
(1979, 15) con-
cluded, ''It is as though the system had a schedule, a will,
and a clock'' and ''All perturbations are reabsorbed elas-
tically without influencing the trend.''
As coal displaced wood, and oil displaced coal, so
would economic and technical imperatives ensure the
displacement of oil by natural gas, nuclear, and solar
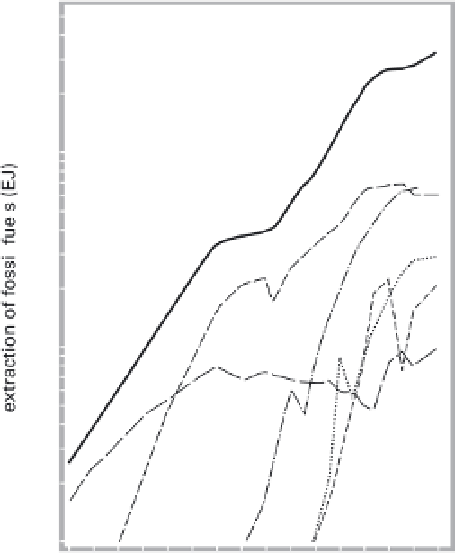
9.1 Exponential rise of global fossil fuel production, 1850-
2000. Plotted from data in UNO (1956), Etemad et al.
(1991), and BP (2006).
production lead ended in the early 1890s, and the
United States has been dominant ever since. The USSR
was in second place from the late 1940s until its demise
in 1990, and Russia retained the second place until 2003,
when its primary commercial energy production was sur-
passed by that of China.
The recent origins of global TPES have been some-
what less uneven than in the past, but the skewness is still
considerable. In 1975 the two superpowers, with nearly
12% of the world's population, produced about 47%
of all fossil fuels. In 2005 the top two producers, the
United States and China, with 25% of the world's popu-
lation, extracted nearly 30% of all fossil fuels; the five