Environmental Engineering Reference
In-Depth Information
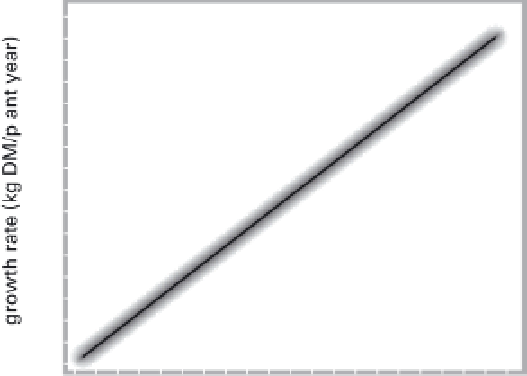
3.11 (a) Plant growth rates scale as M
3=4
, and (b) plant body
lengths scale as M
1=4
, for species whose mass spans 20 OM.
Based on Niklas and Enquist (2001).
And while heterotrophs have similar allometric expo-
nents but a different normalization constant (different
intercepts when graphed), photoautotrophs across the
entire range of extant body masses conform to a single
allometric pattern. This means that the relative growth
rate decreases with increasing plant size as M
1
=
4
. This
uniformity despite differences in phylogenetic affiliation
and habitat is explained by shared hydrodynamics
and biomechanics that govern the resource distribution
through hierarchical branching networks of plants
(West, Brown, and Enquist 1999).
Theoretical explanation of this functional unity rested
on indispensable fractal-like distribution networks (in
plants they have to transport photosynthate from leaves
and transpire water through roots, stems, and leaves)
that evolved to maximize metabolic capacity and effi-
ciency by maximizing exchange surfaces and throughputs
while minimizing transport distances and transfer rates
(West, Brown, and Enquist 2000). This uniformity
means that NPP is largely insensitive to species composi-
tion: identical density of similarly massive plants fixes the
same amount of carbon. Because the abundance of ter-
restrial plants per unit area scales as M
3
=
4
, and their in-
dividual annualized production rates scale as M
3
=
4
, the
rate of total community production (the product of the
two variables) scales as M
0
, and hence the phytomass
production (and the overall claim on resources) should
be invariant as to plant size or species composition.
Total energy flux through a plant community is thus
not dictated by individual body size but limited by the
resource supply. Belgrano et al. (2002) extended this
relation also to marine phytoplankton, confirming that