Geography Reference
In-Depth Information
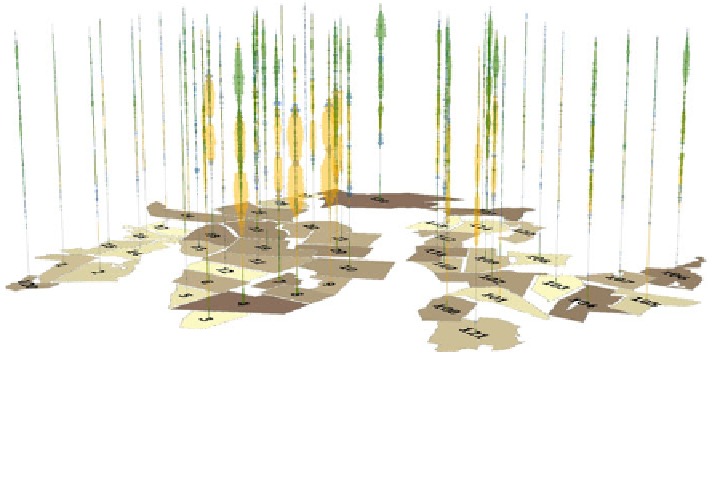
Fig. 1 Daily patterns of three out of a total of nine activities for a population cartogram of
Halifax CTs. The three activities shown are work (orange), travel (blue) and leisure (green). The
vertical dimension is time of day with 0:00 am at the bottom. Granularity of the data is 5 min.
Colours of the cartogram represent volume of all 9 activities, the darker the colour, the more
activities occurred in the CT (Zhao et al.
2008
, p. 202)
cube: a 2-D representation of the geography of zones combined with a vertical z
dimension showing time. This is a very simple diagram which retains space as a
basic factor and attaches to each area a vertical line supporting the temporal record
of three heavily generalised activities in each zone over the course of a day. Partial
opacity is used to allow comparison of the three activity levels across the day.
Although the actual movement of individuals is not shown at all, the aggregate
activity patterns at different times tell us a great deal about the functioning of
Halifax and its suburbs. It utilizes the acknowledged power of Hägerstrand's
aquarium (Parkes and Thrift
1980
) to show the major time use patterns in Halifax,
but on a geography that is represented as a cartogram to allow a better commu-
nication of the densely populated downtown area. To facilitate user interpretation
and a closer link between the cartogram and the geographical map of Halifax, the
shape of each Census Tract (CT) in the cartogram remains identical to that in a
geographical map and CTs are labeled with their identification codes. The vertical,
overlain columns show the differentiated patterns of activity across the city over
time. This clearly reveals the spatio-temporal pattern of the city's key drivers:
traveling, working and leisure.
The Ringmap itself is our second demonstration (Fig.
2
) and features a portrayal
of the levels of a specific activity divided by 5-minute intervals, which are ordered
clockwise on a 24-h time wheel. Gone is the aquarium and dimensionalised space and
time as the focus is on the detail of a specific activity in high resolution. Figure
2
shows two intertwining ringmaps, where each ring represents an abstract spatial
zone, a CT, and each sector depicts a 5-minute interval of a 24-h day. An extra spatial
dimension is provided by serialising the CTs in order of physical distance from the