Geography Reference
In-Depth Information
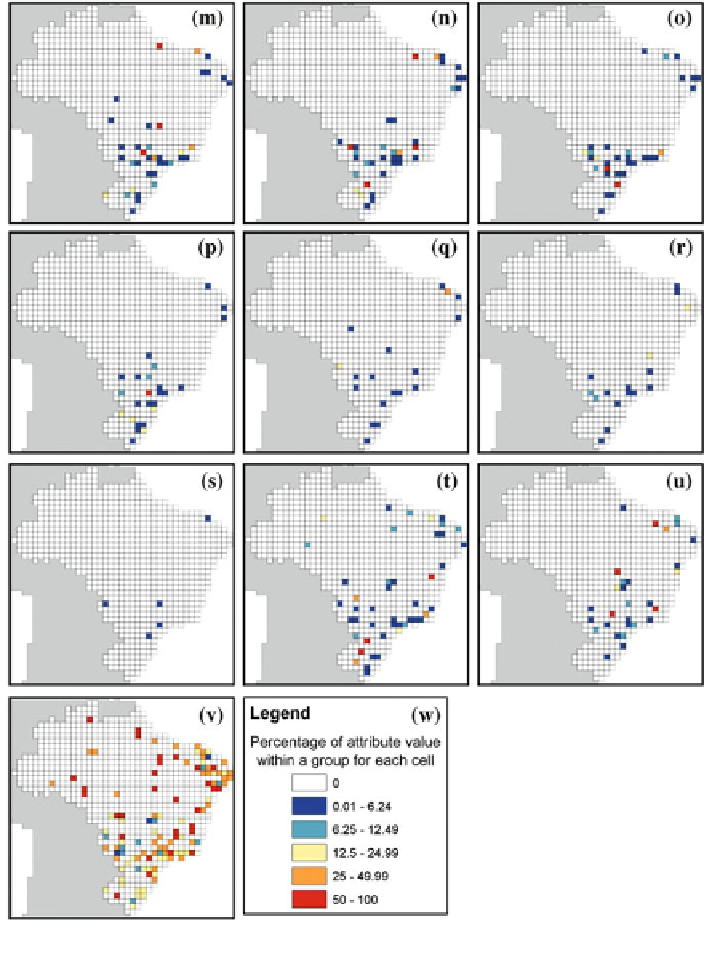
Fig. 11
continued
(rather than the map comparison needed for Figs.
4
,
5
,
6
,
7
,
8
,
9
,
10
,
11
), following
the natural groupings of the data, in practice gleaned by eye from a histogram
(MacEachren
1994
).
In (a) there is a positive relationship showing on the scatterplot between murder
(as
crime
victim
type)
and
violence
(as
crime
type),
which
is
predictable.