Geography Reference
In-Depth Information
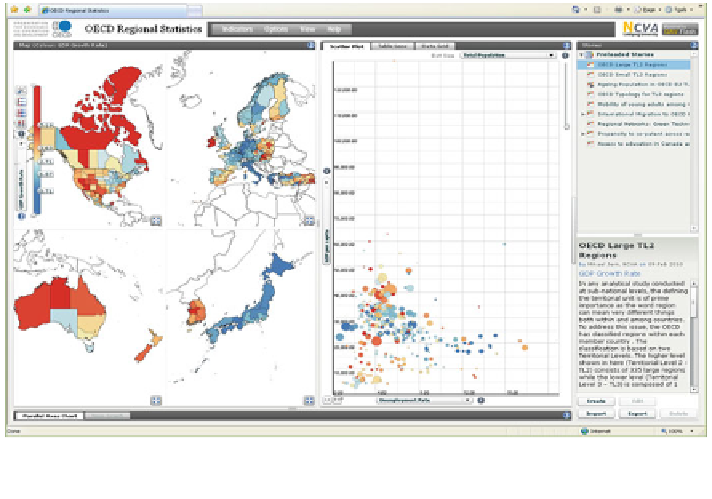
Fig. 1 Organisation for Economic Cooperation and Development (OECD) eXplorer, developed
by NComVA (Norrköping Communicative Visual Analytics), Sweden 2011 NComVA.com
include Weaver et al. (
2007
) investigation of historic visit data using dimensioned
calendars to mine temporal patterns as well as conventional spatial mapping, Guo's
(
2007
) analysis of interaction patterns in pandemic spread and Sips et al. (
2007
)
research into mining spatiotemporal patterns in data warehouses. Jankowski et al.
(
2010
) used geovisual analytics to discover people's spatiotemporal patterns and what
landmarks they visited from volunteered photographs (on Flickr) in the greater Seattle
area. The geovisual analytics software used in this research is Open Statistics eXplorer,
developed by NComVA (Norrköping Communicative Visual Analytics) in Sweden.
2.1.1 OECD eXplorer
The eXplorer web-based software (Fig.
1
) was originally developed for the
Organisation for Economic Cooperation and Development (OECD) (stats.oec-
d.org/OECDregionalstatistics/). One of the major aims of OECD is to promote
policy analysis and information exchange in the areas of regional development,
regional competitiveness as well as urban and rural development (OECD
2011
).
The OECD Regional Database is a digital resource that helps them in this, and
specifically OECD eXplorer facilitates the important role of information exchange.
The Regional Database comprises data for about 50 indicators (demographic,
economic, social and labour market) in more than 1700 subregions of OECD
countries (Jern
2009
).
eXplorer itself is an online interface with choropleth, scatterplot and optional
histogram/parallel coordinate plot display interactively linked. Thus many data