Geography Reference
In-Depth Information
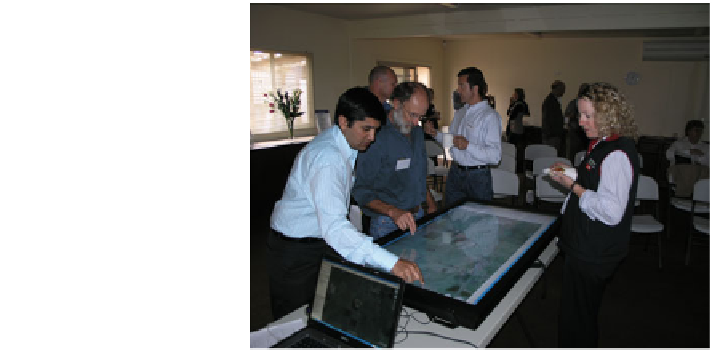
Fig. 6 Demonstrating the
climate change visualisation
products at the workshop
using touch table technology
there is a clear need for the 3D model builders to take an ethical approach for the
development and application of such powerful visual tools.
5 Users' Response and Discussion
There have been a number of studies into the application of information visual-
isation tools for communicating climate change (Sheppard
2005
; Nicholson-Cole
2005
; Dockerty et al.
2005
), and an integral aspect of this body of research is end-
user perceptions. The landscape- and farm-scale climate change visualisation
products described in our research have been made available online through the
Victorian Resource Online Geographical Visualisation Portal
(
www.dpi.vic.gov.au\vro\demodairy
)
. This has enabled stakeholders to test and
familiarise themselves with the interfaces and data.
Sheppard (
2005
) pointed out that the use of 3D realistic visualisation without
proper warning and context may lead potential end-users to confuse the depicted
future with reality, rather than seeing them as a representation of a variety of
possible future options. To overcome this risk, our climate change visualisation
products were presented in a facilitated environment, during a 1 day workshop at
the Demo Dairy site, on 8 December 2009. Workshop participants were allowed to
individually interact with the visualisation products using both a standard laptop,
(simulating the home environment) and a touch table (Fig.
6
). The touch table
supported a more open facilitated environment. This workshop was one of the first
attempts to use visualisation tools to communicate local climate change impacts to
the dairy industry in Australia.
Twenty local stakeholders (a mix of dairy farm managers and staff from the
DPI, Farm Services Victoria Division) took part in the workshop. They were asked
to complete a questionnaire to provide feedback on the perceived 'usefulness' of

