Environmental Engineering Reference
In-Depth Information
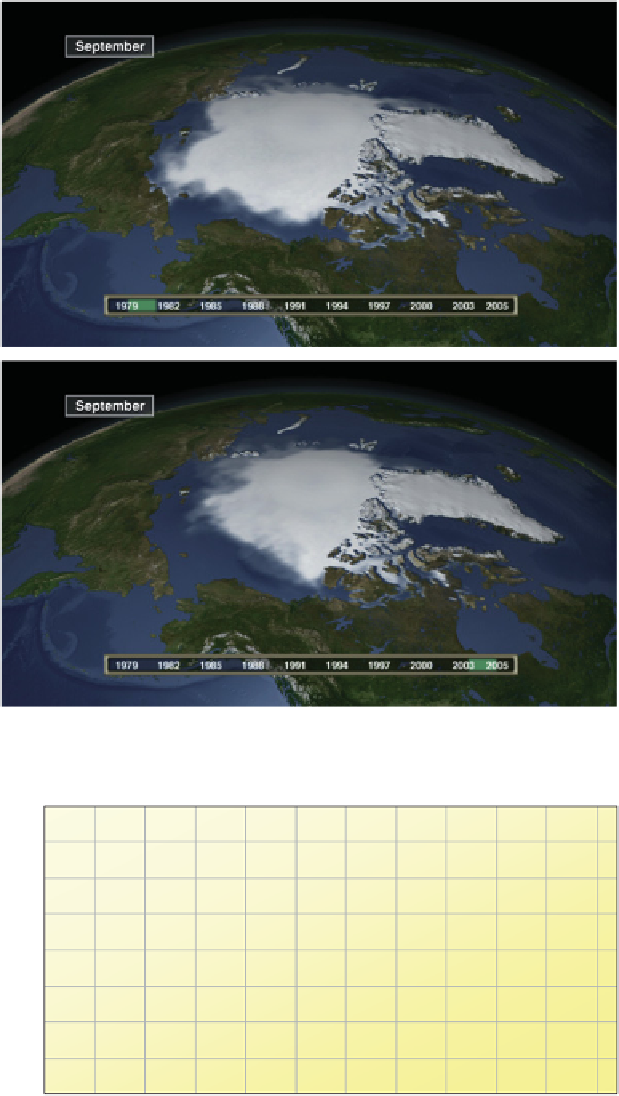
Figure 2.2
Arctic ice coverage in September, calculated for the years 1979 to 1981
(above) and for the years 2003 to 2005 (below).
Source: NASA, svs.gsfc.nasa.gov.
160
bill.
€
total damage
insured damage
(in 2006 values)
trend of total damage
140
120
100
80
60
40
20
0
1950 1955 1960 1965 1970 1975 1980 1985 1990 1995 2000 2005
Figure 2.3
Total damage and insured damage due to major natural catastrophes
worldwide.
Data: Munich Re Group (Quaschning, 2007).