Environmental Engineering Reference
In-Depth Information
In addition to producing chemicals at high temperatures, solar thermal energy can
also be used to produce hydrogen. This does not require a circuitous route that starts
with generating electricity, followed by electrolysis. At high temperatures hydrogen
can be produced through a solar-chemical process. For example, the chemical
system could be in the receiver of a solar tower. Hydrogen is treated as an important
energy source, particularly in the transportation sector and in fuel cells. If a hydro-
gen economy ever becomes a reality, concentrating solar-chemical systems could
play a major role in hydrogen production.
7.3 Planning and Design
As a rule, solar-thermal power plants are classic plants. Due to their size, they cost
millions of euros. Solar plants are almost always planned and built by large corpora-
tions or industrial companies. The design of these plants is usually very complex.
It takes teams of engineers a long time to do the detailed planning. One of the main
goals is to optimize power plants from an economic point of view.
Private individuals are not likely to have any involvement in the planning of solar
power plants, unlike the situation with small photovoltaic systems and solar thermal
systems that heat tap water or provide supplemental heating. However, the rise in
the number of solar power plants is presenting many opportunities for investment
in this area. Therefore, it is worth taking a quick look at the planning aspects.
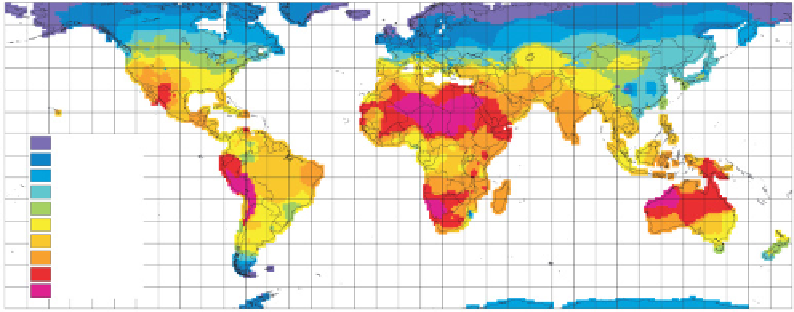
Because concentrating solar power plants suffer a major reduction in effi ciency in
the partial load area, the aim should be to build them mainly in countries that get a
lot of sunshine. The regions currently of interest are those with an annual total global
radiation of at least 1800 kilowatt hours per square metre (kWh/m
2
). The optimal
values are clearly those over 2000kWh/m
2
. These areas appear in red or pink in
Figure 7.13 .
640.. 900
900.. 1050
1050.. 1200
1200.. 1350
1350.. 1500
1500.. 1700
1700.. 1900
1900.. 2100
2100.. 2300
> 2300
Figure 7.13
World map with annual totals for solar global radiation in Wh/m
2
.
Source: Meteotest, www.
meteonorm.com.