Environmental Engineering Reference
In-Depth Information
systems fed 4.3 billion kilowatt hours of electric power into the grid, which was a
0.7% share of the overall electricity supply. Photovoltaics was thereby supplying
more than one million households with carbon-free electricity. Photovoltaics com-
panies in Germany generated a turnover of 7 billion euros and used it to create 48 000
future-orientated workplaces. The Federal Association for Solar Economy is counting
on more than 100 000 workplaces by 2020 (Bundesverband Solarwirtschaft, 2009).
5.8 Outlook and Development Potential
Even if the quantity of solar power is still relatively small, in the medium term
photovoltaics will be able to provide the largest share of environmentally compatible
electricity supply. From a purely mathematical standpoint, it could be used to supply
the world's entire energy needs. This would only take a fraction of the surface of
the Sahara Desert to accomplish. Even countries like Great Britain, Germany and
France would be able to cover all their electricity requirements through photovolta-
ics. On the other hand, from a technical perspective it is not a good idea to rely
solely on one technology for the future supply of energy. Photovoltaic systems work
well in combination with other renewable energy systems, such as wind power,
hydropower and biomass systems. A well-planned combination of systems will
increase supply reliability and avoid the building of large storage systems to ensure
suffi cient supplies are available at night and during the winter.
Costs will have to drop further before large numbers of countries start using pho-
tovoltaics on a considerably larger scale than at present. Past experience has shown
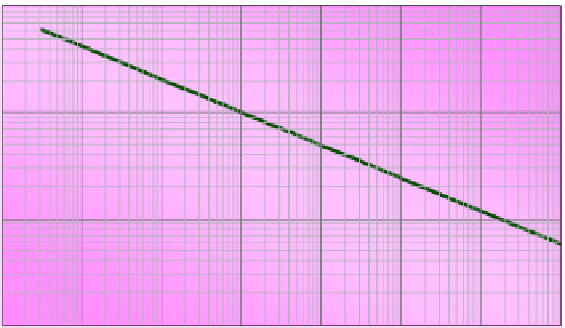
that major cost reductions are possible. Whereas the price of photovoltaic modules
was still around 60 infl ation-adjusted US dollars per watt in 1976, by 2007 it had
already dropped to around 3 dollars per watt (Figure 5.19).
100
1976
$
2000
W
p
1980
1990
10
2007
2000
2020
1
0.1
0.0001
0.001
0.01
0.1
1
10
100
GW
p
cumulated photovoltaic module production
Figure 5.19
Development of infl ation-adjusted photovoltaic module prices on the basis
of total quantity of modules produced worldwide.