Geoscience Reference
In-Depth Information
Table 3-3.
Spectra, bands, wavelengths (
μ
m) and spatial resolutions for the Thematic Mapper of Landsats 4 and 5
and the Enhanced Thematic Mapper Plus of Landsat 7. Bands are arranged according to wavelength.
Spectrum
TM (4 & 5)
Wavelength
Resolution
ETM
+
(7)
Wavelength
Resolution
Blue
Band 1
0.45-0.52
30 m
Band 1
0.45-0.52
30 m
Green
Band 2
0.52-0.60
30 m
Band 2
0.52-0.60
30 m
Red
Band 3
0.63-0.69
30 m
Band 3
0.63-0.69
30 m
Near-infrared
Band 4
0.76-0.90
30 m
Band 4
0.77-0.90
30 m
Panchromatic
-
-
-
Band 8
0.52-0.90
15 m
Mid-infrared
Band 5
1.55-1.75
30 m
Band 5
1.55-1.75
30 m
Mid-infrared
Band 7
2.08-2.35
30 m
Band 7
2.09-2.35
30 m
Thermal infrared
Band 6
10.4-12.5
120* m
Band 6
10.4-12.5
60 m
* data collected at 120 m spatial resolution, but resampled and distributed at 60 m. Based on U.S. Geological Survey
(http://eros.usgs.gov/#/Find_Data/Products_and_Data_Available/band).
wetlands, these instruments detect red and near-
infrared wavelengths for vegetation analysis
over broad regions. Thus, the state of the world's
vegetation can be monitored for seasonal and
interannual changes.
At the moderate-resolution level, Landsat is
the longest running of all Earth resources satel-
lite systems. The success of Landsat spawned
many similar earth-resources satellites in the
late twentieth century by the United States and
several other countries (Lauer, Morain and Salo-
monson 1997; Tatem, Goetz and Hay 2008). Late
in 2008, the U.S. Geological Survey made all
archive Landsat datasets freely available to the
public, which opened tremendous potential for
long-term analysis of land-cover conditions.
The 1970s Landsats (1, 2, 3) carried a Multi-
Spectral Scanner (MSS) which detected two
visible bands (green, red) and two near-infrared
bands at 80 m resolution. Landsats 4 and 5,
launched in the early 1980s, had the MSS as well
as the more advanced Thematic Mapper (TM),
which has seven bands and improved spatial
resolution (Table 3-3). In the 1990s, Landsat 6
failed to achieve orbit, but Landsat 7, launched in
1999, carries an Enhanced Thematic Mapper Plus
(ETM
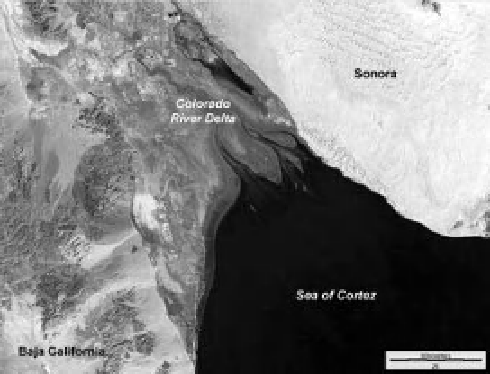
Figure 3-14.
False-color composite Landsat TM image
of the Colorado River delta in the Sea of Cortez,
Mexico (see Color Plate 3-14). Bands 3 (red), 4
(near-infrared) and 5 (mid-infrared) color coded as
blue, green and red. Irrigated crops are bright
yellow-green; dry mud/salt l ats are bright cyan; sand
dunes are near white. Landsat 5, March 2004. Image
from NASA; processing by J.S. Aber.
water-resource investigations (e.g. USGS 1995).
We employ Landsat imagery extensively in
this topic to illustrate spatial and temporal char-
acteristics of selected wetlands. Single-band
images are presented in gray tones. Composite
images employ three bands that are color coded
to produce false-color pictures; most examples
presented herein are TM bands 3, 4, 5 and 2, 5,
7 (Fig. 3-14). Other band combinations are pos-
sible as well as multi-temporal composites (Pavri
and Aber 2004).
) instrument. In spite of some technical
issues, Landsats 5 and 7 are still functioning with
Landsat data now spanning four decades, and the
Landsat Data Continuity Mission is scheduled for
launch in December 2012 (National Aeronautical
and Space Administration (NASA) 2011a).
Landsat imagery has proven of great value
for wetland studies and is widely utilized for
+