Geoscience Reference
In-Depth Information
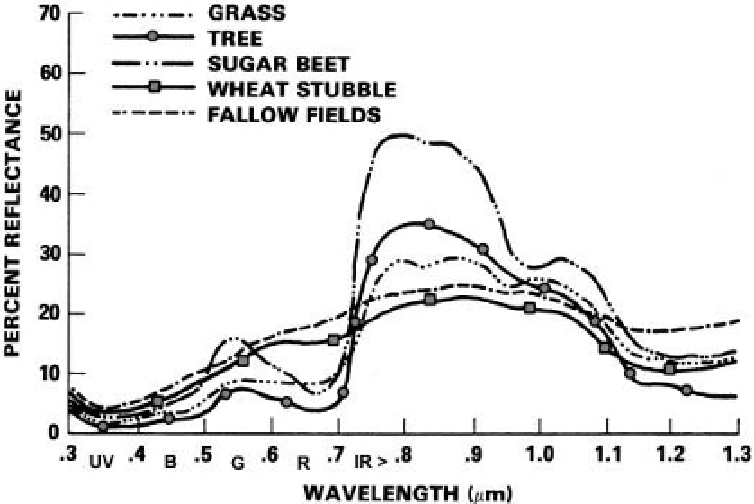
Figure 3-7.
General spectral rel ectance curves for selected vegetation. Note blue (B) and red (R) absorption, weak
green (G) rel ection, and strong near-infrared (IR) rel ection of active plants in contrast to stubble or fallow soil.
Adapted from Short (1982, Fig. 3-5B).
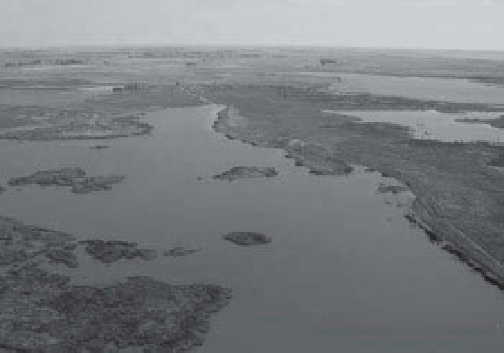
A
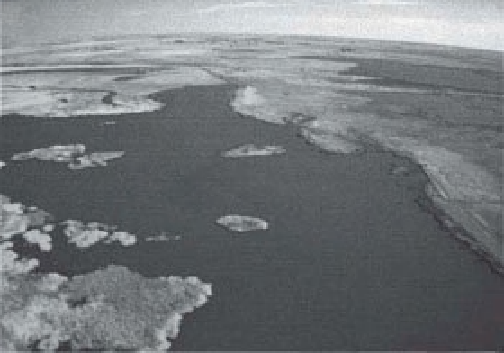
B
Figure 3-8.
Color-visible (A) and color-infrared (B) digital images of marsh at the Nature Conservancy, Cheyenne
Bottoms, central Kansas, United States (see Color Plate 3-8). Active vegetation appears in bright red-pink colors in
the latter. Kite aerial photographs from Aber et al. (2009, Fig. 5).
impact on visible color. For further discussion
of soil color, see section 3.4.1 below.
Advanced Very High Resolution Radiometer
(AVHRR) carried onboard several NOAA weather
satellites as well as the Moderate Resolution
Imaging Spectroradiometer (MODIS) instrument
on NASA's Terra and Aqua satellites (Fig.
3-13). AVHRR typically provides data at 1 km
spatial resolution; MODIS normally operates at
250 m resolution. Of particular importance for
3.2.3 Macro-level systems
Several satellite systems provide low spatial
resolution imagery in visible and infrared por-
tions of the spectrum. These include the