Agriculture Reference
In-Depth Information
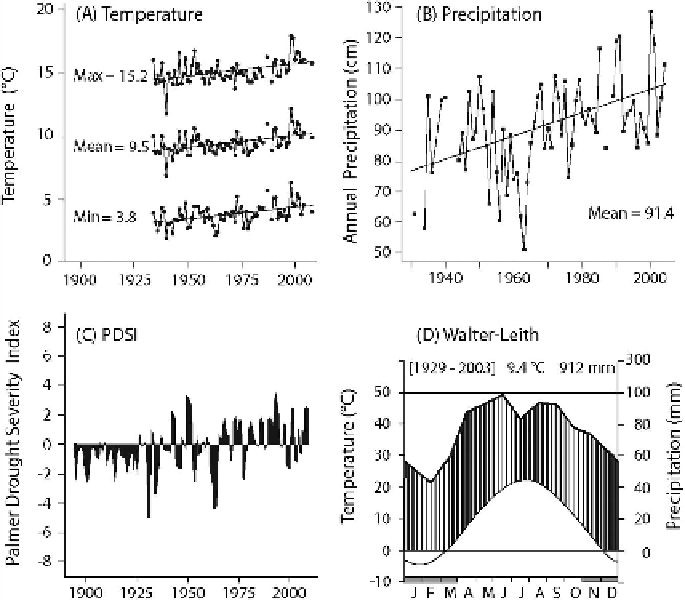
Figure 1.6
. Long-term (1929-2008) trends for temperature and precipitation at KBS: (A)
annual means of daily air temperatures showing maximum (upper line), minimum (bottom),
and daily (24-hour) values (middle) in °C (means for the 80-year period are given to the left
of each data series); (B) total annual precipitation (cm); (C) mean annual Palmer Drought
Severity Index (PDSI); and (D) monthly mean air temperature and precipitation depicted
as a Walter-Leith climate diagram. Negative PDSI indicates water deficit conditions for the
region. Redrawn from Peters et al. (2013).
Hamilton 2015, Chapter 11 in this volume, Fig. 11.3). The mean annual tempera-
ture is 10.1°C, ranging from a monthly mean of -3.8°C in January to 22.9°C in
July (1981-2010; NCDC 2013). Climate change models predict significant altera-
tions in the amount of precipitation and its variability for the Midwest, in par-
ticular, the frequency and intensity of precipitation events (Easterling et al. 2000,
Weltzin et al. 2003). At KBS, air temperature and precipitation have both shown
increasing trends over the past several decades (Fig. 1.6), as has the incidence of
large rain events. A warming trend is also apparent from the ice records of area
lakes (Fig. 1.7).
The physiography of southwest Michigan is characteristic of a mature glacial
outwash plain and moraine complex. The retreat of the Wisconsin glaciation,
~18,000 years ago in southwest Michigan, left a diverse depressional pattern of
many kettle lakes and wetlands interspersed among undulating hills and outwash