Agriculture Reference
In-Depth Information
12
Measured, 0-26 cm
Simulated, 0-26 cm
Measured, 26-77 cm
Simulated, 26-77 cm
10
8
6
4
2
0
180
190
200
210
220
230
240
250
260
Day of the Ye ar
Figure 10.4
. Measured and simulated water content for the soil profile (0-26 cm) and
(26-77 cm) in the medium elevation zone (upper saddle) for the entire season in Durand,
Michigan. Redrawn from Basso (2000).
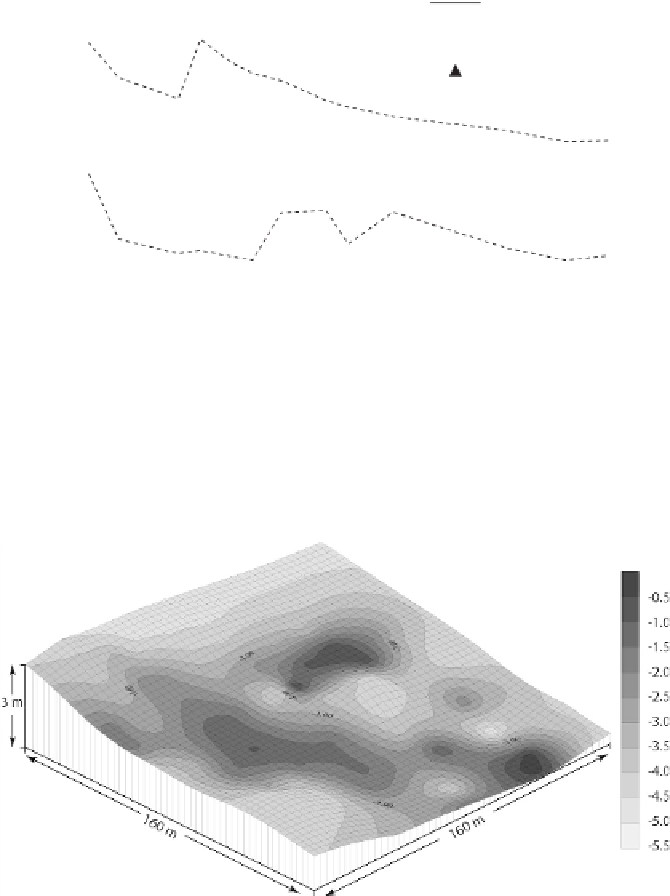
Figure 10.5
. Simulated kriged map of net surface flow (cm) calculated as the difference
between run-on and run-off using SALUS-TERRAE on a sandy loam soil in Durand,
Michigan. Redrawn from Basso (2000).
A current limitation in most crop models is the assumption of uniform plant
distribution. Yield variability at the field scale is the norm rather than the exception
(Sadler et al. 1994; Basso et al. 2001, 2012b). Visual observations as well as mea-
surements commonly indicate that crops are not uniformly distributed, and there-
fore assuming they are can be an unrealistic assumption and a significant source