Agriculture Reference
In-Depth Information
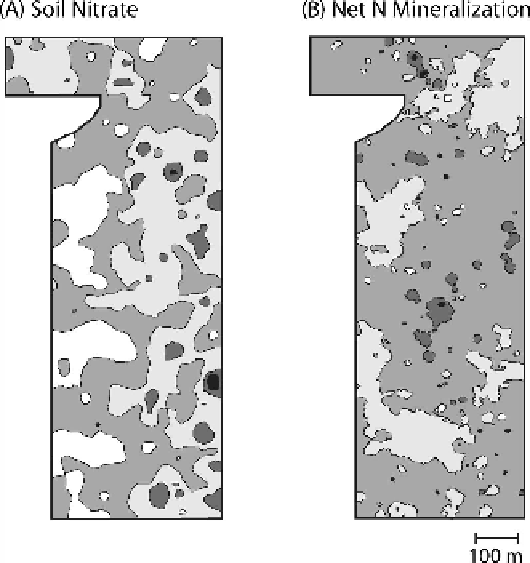
Figure 9.10
. Isopleths for A) soil nitrate (5.7-15.1 mg N g soil
-1
) and B) net N mineraliza-
tion (0.30-0.70 mg N g
-1
d
-1
) across the 48-ha MCSE prior to plot establishment. Shading
patterns denote five equal increments in levels for each variable across its range. Distance
unit in meters. Redrawn from Robertson et al. (1997) with permission of the Ecological
Society of America; permission conveyed through Copyright Clearance Center, Inc.
et al. 2009) and elsewhere, and yield patterns are concomitantly related to nutri-
ent availability (Robertson 1997, Kravchenko and Bullock 2000, Kravchenko
et al. 2006, Kravchenko and Robertson 2007). Applying fertilizer in a spatially
targeted manner that recognizes this variability can concentrate N on those areas
of a field with the highest yield potential and avoid adding N to those areas not
likely to be N responsive. For most fields, less fertilizer N will be added using this
approach than applying a generally recommended rate to the entire field. (e.g.,
Mamo et al. 2003, Scharf et al. 2005). On-the-go fertilizer placement, which uses
spectral reflectance of the canopy to spatially judge real-time crop N needs (Raun
et al. 2002, Li et al. 2009, Scharf and Lory 2009), is a promising technology for
improving NUE.
Better management of crop residues can undergird, supplement, and even
replace synthetic fertilizers. The quality of organic residues plays an especially
important role and can influence N availability by (1) adding N to soils, (2) affect-
ing N mineralization-immobilization patterns, (3) serving as an energy source for
microbial activities, and (4) acting as precursors to N sequestration in soil organic
matter (Palm and Rowland 1997; Paul et al. 2015, Chapter 5 in this volume).