Agriculture Reference
In-Depth Information
of N
2
O production in fertilized vs. unfertilized soils suggest that ~1% of added N
is converted to N
2
O, and this is the factor currently used by most national green-
house gas (GHG) inventories to estimate N
2
O production (IPCC 2006; Gelfand and
Robertson 2015, Chapter 12 in this volume). However, the response curves of N
2
O
emission vs. N fertilizer rate are beginning to illustrate a more nonlinear relation-
ship that suggests N
2
O fluxes increase disproportionately as fertilizer rates exceed
the crop's capacity to utilize added N (Shcherbak et al. 2014).
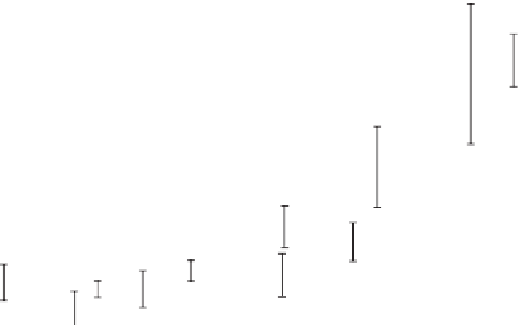
McSwiney and Robertson (2005), for example, reported a nonlinear, expo-
nentially increasing N
2
O fertilizer response along the nine N fertilizer rates in
corn at the KBS LTER Resource Gradient Experiment. They found that N
2
O
emissions more than doubled at N fertilizer rates greater than the level at which
yield was maximized. Likewise, across six N fertilizer rates in winter wheat,
Millar et al. (2014) also found an exponential increase in N
2
O emissions with an
increasing N rate. Hoben et al. (2011) confirmed this relationship in commercial
corn fields across Michigan (Fig. 9.9), and Grace et al. (2011) used this relation-
ship to revise estimates for N
2
O emissions from corn in the U.S. North Central
Region for 1964-2005 from 35% to 59% of all GHG emissions associated with
corn, and the revised N
2
O emission was equivalent to 1.75% of N fertilizer
500
30
400
Corn
Wheat
20
300
10
200
0
0
50
100
150
200
250
Fertilizer Rate (kg N ha
-1
)
Figure 9.9
. Nitrous oxide (N
2
O) response to increasing N fertilizer rates for wheat (g
N
2
O-N ha
-1
season
-1
) at the KBS LTER Resource Gradient Experiment (adapted from Millar
et al. 2014), and for corn (g N
2
O-N ha
-1
day
-1
) in five commercial corn fields in Michigan
(redrawn from data presented in Hoben et al. 2011). For wheat, emissions were measured
using automated sampling chambers; values are means determined from sub-daily fluxes
over 47 days (right axis) ± SE (n = 159 - 230, repeated measures). For corn, emissions were
measured using manual sampling chambers; values are means (left axis) ± SE (n = 32, 8 site
years × 4 replicate blocks).