Agriculture Reference
In-Depth Information
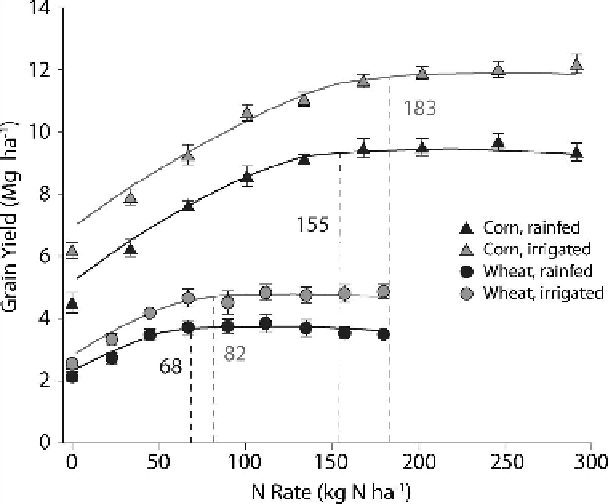
Figure 9.2
. Yield responses to incremental increases in synthetic N fertilization rate in corn
and winter wheat at the KBS LTER Resource Gradient Experiment. Economic Optimum
Nitrogen Rates (EONR; dashed lines) were calculated as the weighted mean of four yield
response curves (quadratic, quadratic-plateau, linear-plateau, and spherical) using the
International Plant Nutrition Institute Crop Nutrient Response Tool (CNRT) v4.5;
http://
nane.ipni.net/article/NANE-3068)
. The EONRs for rainfed and irrigated corn are based on
average yields for the 2003, 2004, 2005, 2008, and 2011 crop years, and EONRs for rainfed
and irrigated wheat are based on average yields for the 2007 and 2010 crop years. The agro-
nomic optimum nitrogen rates (AONR) were 191 and 198 kg N ha
-1
for rainfed and irrigated
corn, respectively, and for rainfed and irrigated wheat, 94 and 108 kg ha
-1
, respectively (not
shown for clarity).
N atoms. Biological N fixation (BNF) is the dominant process by which this N
becomes reactive:
N
2
+ 8 H
+
+ 6 e
−
→ 2 NH
3
+ H
2
Most BNF is carried out by bacteria possessing the nitrogenase enzyme, and in ter-
restrial ecosystems most BNF is plant-associated (Vitousek et al. 2013).
Plant-mediated N fixation is largely facultative: where soil N is readily avail-
able, plants allocate less fixed carbon (C) to BNF bacteria and less N is fixed. Thus,
fixation rates can vary widely even within the same crop species. Soybeans when
N-fertilized, for example, fix very little N, but when grown in infertile soil without
added N, they can fix 98% of a 200 kg ha
−1
N requirement (Ruschel et al. 1979).
In the MCSE Conventional system, soybeans fix 56-58% of their aboveground
N needs based on
15
N natural abundance experiments (Gelfand and Robertson, in