Agriculture Reference
In-Depth Information
1.0
0.8
0.6
0.4
0.2
0.0
1994
1996
1998
2000
2002
2004
2006
2008
Year
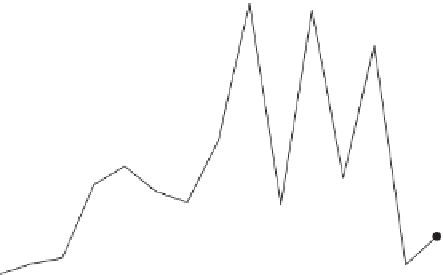
Figure 8.8
. Mean number of
Harmonia axyridis
captured on yellow sticky card traps placed
in multiple crop and non-crop habitats at the KBS LTER site, 1994-2008. Dotted lines show
the mean numbers of
H. axyridis
from 1994 to 1999 (before soybean aphid arrival) and from
2000 to 2008 (after soybean aphid arrival). Note the response of
H. axyridis
following years
of local
A. glycines
outbreaks (2001, 2003, 2005). Redrawn from Heimpel et al. (2010) with
permission from Springer Science and Business Media.
(A)
(B)
r
2
= 0.39
1.0
1.0
P < 0.001
0.8
r
2
= 0.31
0.6
P < 0.01
0.5
0.4
0.2
0.0
0.0
0.1
0.2
0.3
0.4
0.5
0.6
0.7
12 345 678
Simpson's Diversity (D) at 1.5 km Scale
Proportion Corn at 1.5 km Scale
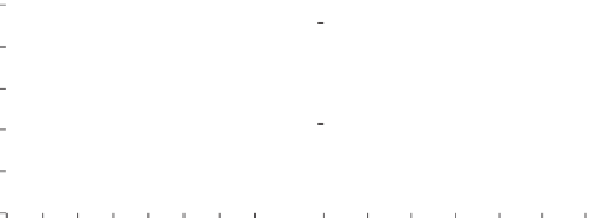
Figure 8.9
. Biocontrol services from coccinellids as a function of landscape diversity (A) and
the dominance of corn within 1.5 km of soybean fields (B). Panel (A) is redrawn from Gardiner
et al. (2009b) with permission of the Ecological Society of America; permission conveyed
through Copyright Clearance Center, Inc. Panel (B) is redrawn from Landis et al. (2008).
in corn production had low landscape diversity and significantly reduced biocontrol
services in soybean fields (Fig. 8.9).
Landscape structure also altered coccinellid community structure, with the
exotic
H. axyridis
more abundant in landscapes with patches of woody vegeta-
tion and native coccinellids more abundant in landscapes with abundant grasslands