Agriculture Reference
In-Depth Information
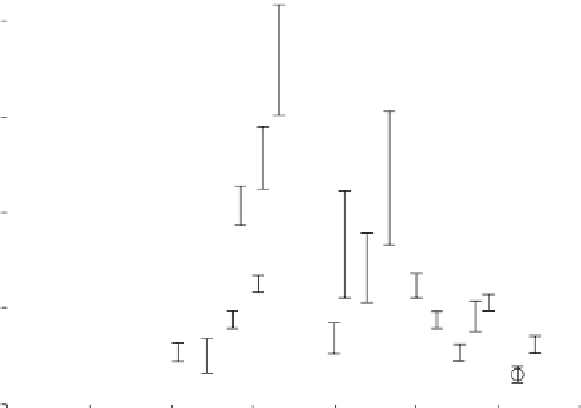
80
Observed
Modeled
60
40
20
0
0
50
100
150
200
250
300
350
Day of Ye ar
Figure 5.5
. Simulated field carbon dioxide (CO
2
) fluxes from the MCSE Conventional sys-
tem in 1994, based on the soil organic matter pools and fluxes shown in Table 5.5. Bars on
observed values indicate standard errors. Redrawn from Paul et al. (1999a) with permission
from Elsevier.
Biochemical Controls on Soil Organic Matter Dynamics
A number of approaches are available to examine the molecular-biochemical struc-
ture of SOM components (Clapp et al. 2005). Two of the newest and most useful
techniques are mid-infrared (mid-Ir) spectroscopy and pyrolysis followed by mass
spectroscopy.
Mid-infrared (mid-IR) spectroscopy is a nondestructive measurement of the
organic functional groups in both bulk soil and its fractions (Fig. 5.6). Mid-IR
spectra show selective absorption by specific SOM functional groups, including
OH, NH, aliphatic OH, carboxyl OH stretch, carbohydrates, aromatics, and N
compounds, and indicate differences between soil fractions (Calderón et al. 2011).
The mid-IR spectra show preferential absorptions of OH, NH, and aliphatic CH
bonds in the interaggregate fraction. These are most often associated with partially
decomposed plant residues. The intraaggregate and silt fractions show little absorp-
tion in these regions, but much higher absorption at 2000-1200 cm
−1
, indicating a
greater presence of carboxylic and aromatic groups. The high, mid-IR absorption
in the 1700-1000 cm
−1
range is attributable to polysaccharides, phenols, aromatics,
and protein amides. Some of the minerals present in clays (particularly silica) also
absorb in these regions (Janik et al. 2007, Calderón et al. 2011).
Principal components analysis of the mid-IR signal of soil fractions from
KBS, Lamberton, Minnesota, Wooster, Ohio, and Hoytville, Ohio, shows similar