Agriculture Reference
In-Depth Information
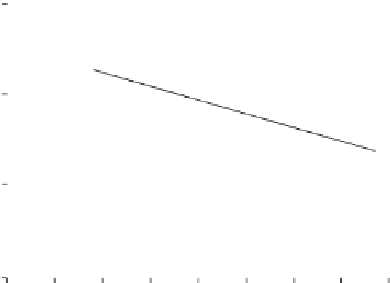
(A) Corn
8
6
4
2
Yield = 7.691 - 0.109 CSI
r
2
= 0.26
0
(B) Soybean
3
2
1
Yield = 2.541 - 0.031 CSI
r
2
= 0.11
0
0
5
10
15
20
25
30
35
40
Crop Stress Index (May - July)
Figure 4.12
. Average annual grain yields of (A) corn and (B) soybean in Kalamazoo
County, Michigan, as a function of the Crop Stress Index (May-July) in Kalamazoo County,
Michigan (1971-2001). See Figs. 4.3 and 4.6 for data sources.
portion. For example, in Kansas, the CSI was greater than 25 in 7 of the 30 years
examined.
Also worth noting is that the slope of increasing corn yield over this period for
Kalamazoo County (0.094 Mg ha
−1
yr
−1
; Fig. 4.11) is almost identical to the slope
for the NCR (0.092 Mg ha
−1
yr
−1
; Fig. 4.4), showing how closely the KBS area
tracked regional trends. Interestingly, the slope of soybean yields for Kalamazoo
County over this same period (0.042 Mg ha
−1
yr
−1
) is greater than that for the NCR
(0.028 Mg ha
−1
yr
−1
).
Climate Change Implications
Agriculture in the NCR will be greatly affected by climate change, with important
consequences for crop stress. The earth's average global surface temperature rose
0.85°C from 1880 to 2012, with each of the last three decades being successively