Agriculture Reference
In-Depth Information
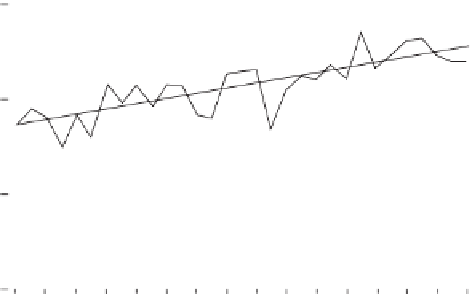
8
(A) Corn
6
4
Yield = -176.1 + 0.092 Year
r
2
= 0.60
2
0
1973
1977
1981
1985 989
1993
1997
2001
3
(B) Soybean
2
1
Yield = -53.45 + 0.028 Year
r
2
= 0.64
0
1973
1977
1981
1985 989
1993
1997
2001
Figure 4.4
. Trends in mean grain yields (Mg ha
-1
) for non-irrigated (A) corn and (B) soy-
bean in the NCR (1971-2001). See Fig. 4.3 legend for data source.
Crop Stress Indices
One of the stresses affecting corn and soybean growth and productivity—and
plants in general—is a moisture deficit. Moisture deficits can cause physiologi-
cal stress in plants and, when coupled with the additional stress of increas-
ing temperatures, can lead to significant crop loss. Several indices have been
derived to relate weather to crop stress and crop loss. Jackson et al. (1988)
reexamined the theoretical basis of the crop water stress index and showed that
measures of canopy temperature, wind speed, crop canopy resistance, evapo-
transpiration, solar radiation, and other factors are important considerations.
In a review of drought indices, Heim (2002) noted that the Palmer Drought
Index (PDI), despite some deficiencies, is still the most widely used index.
However, the PDI requires data on precipitation, evapotranspiration, soil mois-
ture loss and recharge, and runoff (Heim 2002), a range of variables for which
few regions in the world have data.