Environmental Engineering Reference
In-Depth Information
added to the GDP. Examples include unpaid volunteer
work, health care for family members, child care, and
housework. Then the estimated harmful environmen-
tal costs (such as pollution and resource depletion and
degradation) and social costs (such as crime) are sub-
tracted from the GDP.
All economic goods and services have
internal
or
direct
costs
associated with producing them. For example, if
you buy a car, the direct price you pay includes the costs
of raw materials, labor, and shipping, as well as a
markup to allow the car company and its dealers to earn
some profits. Once you buy the car, you must pay addi-
tional direct costs for gasoline, maintenance, and repair.
Making, distributing, and using economic goods
or services also lead to
indirect
or
external costs
that are
not included in their market prices and that affect peo-
ple other than the buyer and seller. For example, ex-
tracting and processing raw materials to make a car
use nonrenewable energy and mineral resources, pro-
duce solid and hazardous wastes, disturb land, and
pollute the air and water. These external costs can have
short- and long-term harmful effects on other people
and on the earth's life-support systems.
Because these costs are not included in the market
price, most people do not connect them with car own-
ership. Even so, the car buyer and other people in a so-
ciety pay these hidden costs sooner or later, in the form
of poorer health, higher costs of health care and insur-
ance, higher taxes for pollution control, traffic conges-
tion, and land used for highways and parking.
Genuine
benefits not
harmful
progress GDP
included in
environmental
indicator
market transactions
and social costs
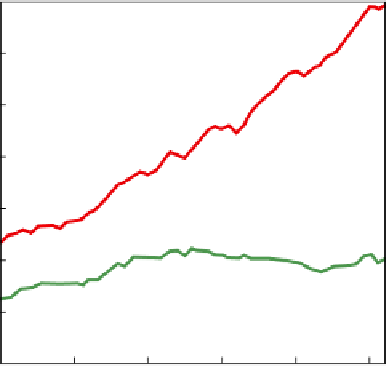
Figure 18-6 compares the per capita GDP and GPI
for the United States between 1950 and 2002. While the
per capita GDP rose sharply over this period, the per
capita GPI stayed nearly flat and even declined slightly
between 1975 and 2002.
The GPI and other environmental indicators un-
der development are far from perfect and include
many crude estimates. Nevertheless, without such in-
dicators, we would not know much about what is hap-
pening to people, the environment, and the planet's
natural capital. With them, we have a way to deter-
mine which policies work. In essence, according to
ecological and environmental economists, if we ignore
these indicators, we attempt to guide national and
global economies through treacherous economic and
environmental waters at ever-increasing speeds using
faulty radar.
Full-Cost Pricing
Including external costs in market prices informs
consumers about the impacts that their purchases
have on the earth's life-support systems and human
health.
For most economists, an
environmentally honest market
system
provides a way to deal with the harmful costs of
goods and services. In this system, the harmful indi-
rect or external costs of goods and services are in-
cluded in the market price of any good or service, so
that its price comes as close as possible to its
full
cost
—its internal costs plus its external costs. Such a
system would allow consumers to make more in-
formed choices because they would be aware of most
or all of the costs involved when they buy something.
Full-cost pricing encourages producers to invent
more resource-efficient and less-polluting methods of
production, thereby cutting their production costs.
Jobs would be lost in environmentally harmful busi-
nesses as consumers more often choose green prod-
ucts, whereas jobs would be created in environmen-
tally beneficial businesses. If a shift to full-cost pricing
took place over several decades, most environmentally
harmful businesses would have time to transform
themselves into environmentally beneficial businesses.
Likewise, consumers would have time to adjust their
buying habits and learn to purchase more environmen-
tally friendly products and services.
Full-cost pricing seems to make a lot of sense. So
why is it not used more widely? Two major reasons ex-
plain why.
Internal and External Costs
The direct price you pay for something does not
include indirect environmental, health, and other
harmful costs associated with its production
and use.
35,000
30,000
25,000
20,000
15,000
10,000
5,000
Per capita genuine progress indicator (GPI)
0
1950
1960
1970
1980
1990
2000
Year
Figure 18-6
Comparison of the per capita gross domestic
product (GDP) and per capita genuine progress indicator
(GPI) in the United States between 1950 and 2002. (Data from
Redefining Progress, 2004)