Environmental Engineering Reference
In-Depth Information
1979
2003
Russia
Russia
North
pole
North
pole
Greenland
Greenland
Alaska (U.S.)
Canada
Alaska (U.S.)
Canada
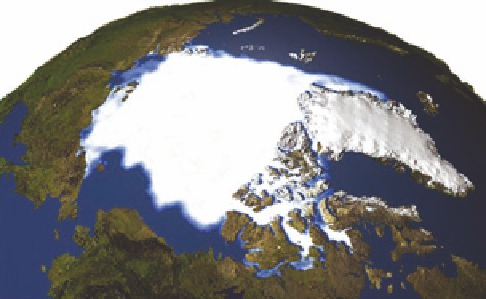
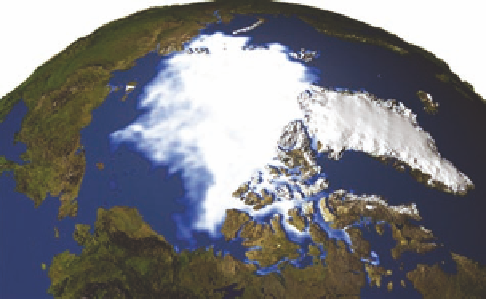
Figure 16-6
Science:
satellite data showing Arctic sea ice in 1979 (left) and in 2003 (right). According to
NASA, the ice cover shrunk by 9% during this period.
Critical thinking: why should you care if ice melts in
the artic sea?
(Data collected by Defense Satellite Program [DMSP] Special Sensor Microwave Imager[SSMI],
Image: NASA)
Figure 16-7
Science:
simplified model of some of major processes that
interact to determine the average temperature and greenhouse gas con-
tent of the troposphere and thus the earth's climate.
Sun
Troposphere
Cooling
from
increase
Greenhouse
gases
CO
2
removal
by plants and
soil organisms
CO
2
emissions from
land clearing,
fires, and decay
Heat and
CO
2
removal
Heat and
CO
2
emissions
Aerosols
Warming
from
decrease
Ice and snow cover
Shallow ocean
Land and soil biotoa
Long-term
storage
Natural and human emissions
Deep ocean