Environmental Engineering Reference
In-Depth Information
Table 16-1 Science: Major Greenhouse Gases from Human Activities
Average
Relative
Time in the
Warming Potential
Greenhouse Gas
Human Sources
Troposphere
(compared to CO
2
)
Carbon dioxide (CO
2
)
Fossil fuel burning, especially coal (70-75%),
100-120 years
1
deforestation, and plant burning
Methane (CH
4
)
Rice paddies, guts of cattle and termites, landfills,
12-18 years
23
coal production, coal seams, and natural gas leaks
from oil and gas production and pipelines
Nitrous oxide (N
2
O)
Fossil fuel burning, fertilizers, livestock wastes,
114-120 years
296
and nylon production
Chlorofluorocarbons
Air conditioners, refrigerators, plastic foams
11-20 years (65-110 years
900-8,300
(CFCs)*
in the stratosphere)
Hydrochloro-
Air conditioners, refrigerators, plastic foams
9-390
470-2,000
fluorocarbons (HCFCs)
Hydrofluorocarbons
Air conditioners, refrigerators, plastic foams
15-390
130-12,700
(HFCs)
Halons
Fire extinguishers
65
5,500
Carbon tetrachloride
Cleaning solvent
42
1,400
*CFC use is being phased out, but these compounds remain in the troposphere for 1-2 decades
and then enter the stratosphere.
16-2 CLIMATE CHANGE
AND HUMAN ACTIVITIES
380
360
340
320
300
Science: Signs That the Troposphere
Is Warming
A considerable body of scientific evidence indicates
that the earth's troposphere is warming, partly
because of human activities.
In 1988, the United Nations and the World Meteoro-
logical Organization established the Intergovernmen-
tal Panel on Climate Change (IPCC) to document past
climate changes and project future climate changes.
The IPCC network includes more than 2,000 climate
experts from 70 nations.
Since 1861, the concentrations of the greenhouse
gases CO
2
,CH
4
, and N
2
Ointhe troposphere have risen
sharply, especially since 1950 (Figure 16-5). According
to studies by IPCC and the U.S. National Academy of
Sciences, humans have increased concentrations of
these greenhouse gases in the troposphere by burning
fossil fuels (which adds CO
2
and CH
4
), clearing and
burning forests and grasslands (which add CO
2
and
N
2
O), and planting rice and using inorganic fertilizers
(which release N
2
O into the troposphere). Since 1980,
the concentration of CO
2
in the troposphere has in-
creased from 280 parts per million (ppm) to 380 ppm,
the highest estimated level in 420,000 years. Within a
few decades, CO
2
levels are projected to exceed 500
ppm and lead to significant warming of the planet.
Although the United States has only 4.6% of the
world's population it is by far the world's largest emit-
280
260
240
220
200
180
Carbon dioxide
+2.5
0
-2.5
-5.0
-7.5
-10.0
Temperature
change
End of
last ice age
160
80 40 0
Thousands of years before present
120
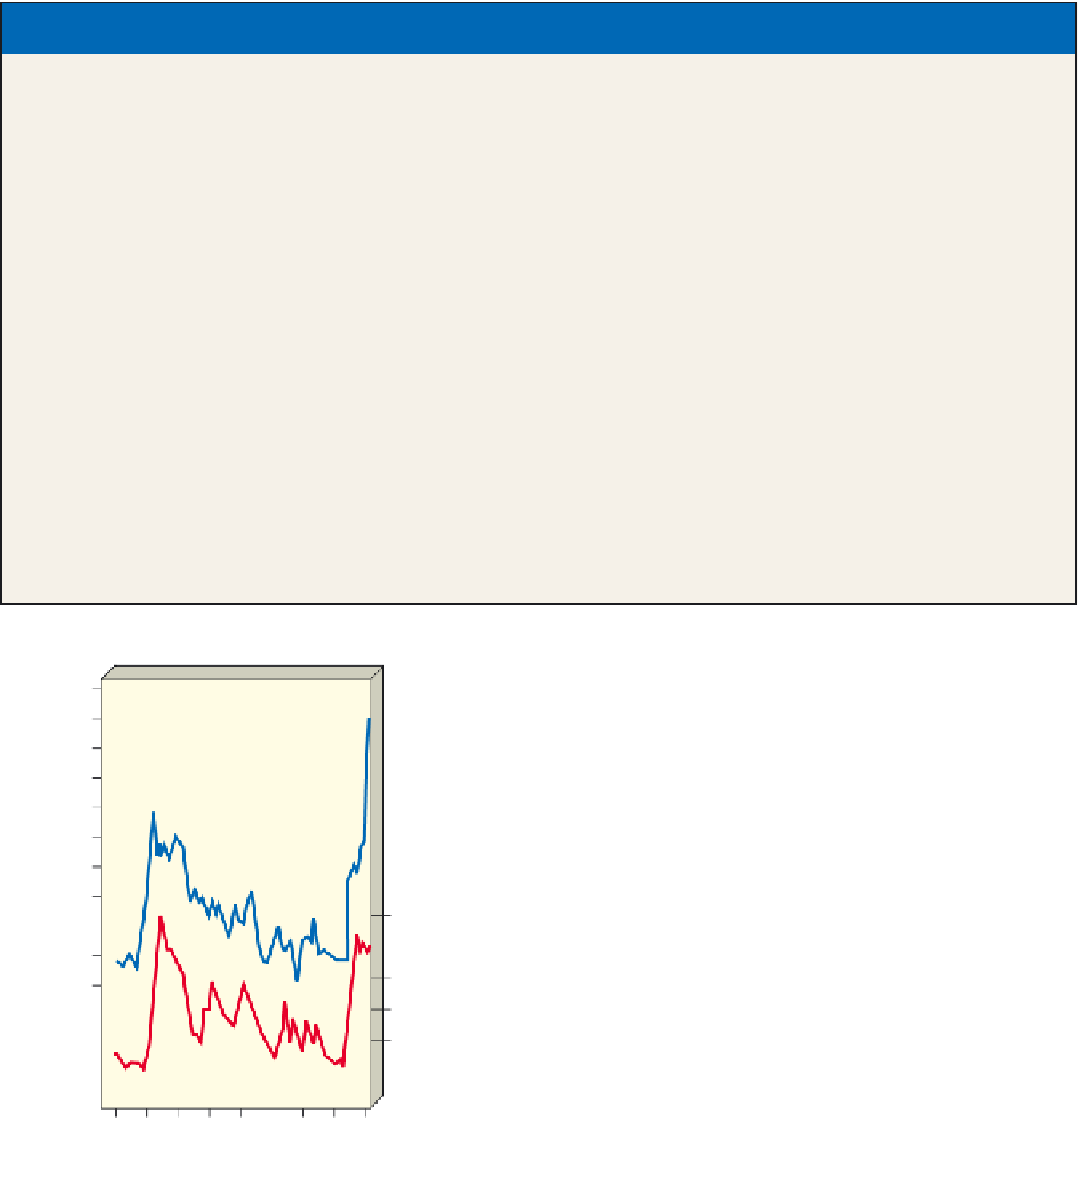
Figure 16-4
Science:
atmospheric carbon dioxide levels and
global temperature. Estimated long-term variations in average
global temperature of the atmosphere near the earth's surface
are graphed along with average tropospheric CO
2
levels over
the past 160,000 years. The rough correlation between CO
2
levels in the troposphere and temperature shown in these esti-
mates based on ice core data suggests a connection between
the two variables, although no definitive causal link has been
established. In 1999, the world's deepest ice core sample re-
vealed a similar correlation between air temperatures and the
greenhouse gases CO
2
and CH
4
going back for 460,000 years.
(Data from Intergovernmental Panel on Climate Change and
National Center for Atmospheric Research)