Environmental Engineering Reference
In-Depth Information
4.7
4.7
5.1
5.4
5.3
5.2
5.5
5.9
5.3
5.5
4.7
5.3
5.2
5.2
5.0
4.5
4.6
4.7
5.9
5.4
5.3
5.3
4.8
4.8
5.5
4.6
5.4
4.7
5.2
4.9
4.6
5.4
5.8
5.6
5.4
4.4
4.5
4.5
4.5
5.3
5.0
4.5
5.3
5.3
4.4
5.7
4.6
4.9
5.7
5.7
5.1
5.1
4.7
4.7
4.5
5.4
4.5
5.3
4.4
4.8
5.8
4.4
5.8
4.9
5.5
5.3
4.5
5.4
4.7
4.4
4.5
5.5
4.9
4.5
4.4
4.4
4.4
4.8
4.8
4.7
5.5
5.6
5.6
4.4
4.7
4.6
5.4
4.6
4.5
4.7
5.3
5.1
4.6
5.8
4.7
5.6
5.2
4.8
4.5
6.0
4.6
5.6
5.3
4.5
6.2
4.8
5.4
4.6
5.5
4.6
5.5
4.7
5.1
5.1
4.6
4.6
5.6
5.4
5.8
5.0
4.6
5.7
5.2
4.8
4.7
5.1
4.7
4.8
4.6
4.6
5.1
4.9
4.6
5.6
4.5
4.6
5.6
4.8
4.6
4.8
4.8
4.9
4.8
5.2
5.5
6.7
5.4
5.1
4.9
5.1
4.7
4.8
5.1
4.8
4.9
5.4
4.7
4.7
4.8
5.2
5.0
4.8
4.8
5.2
5.1
4.8
5.4
5.2
4.8
5.4
4.8
5.2
4.9
5.2
4.7
4.9
4.8
4.8
5.8
4.8
4.5
5.1
4.8
4.8
5.0
4.5
4.9
5.0
Major coal-burning power and industrial plants
≥
5.3
5.0-5.1
4.7-4.8
4.4-4.5
5.0
5.2-5.3
4.9-5.0
4.6-4.7
4.3-4.4
5.1-5.2
4.8-4.9
4.5-4.6
<4.3
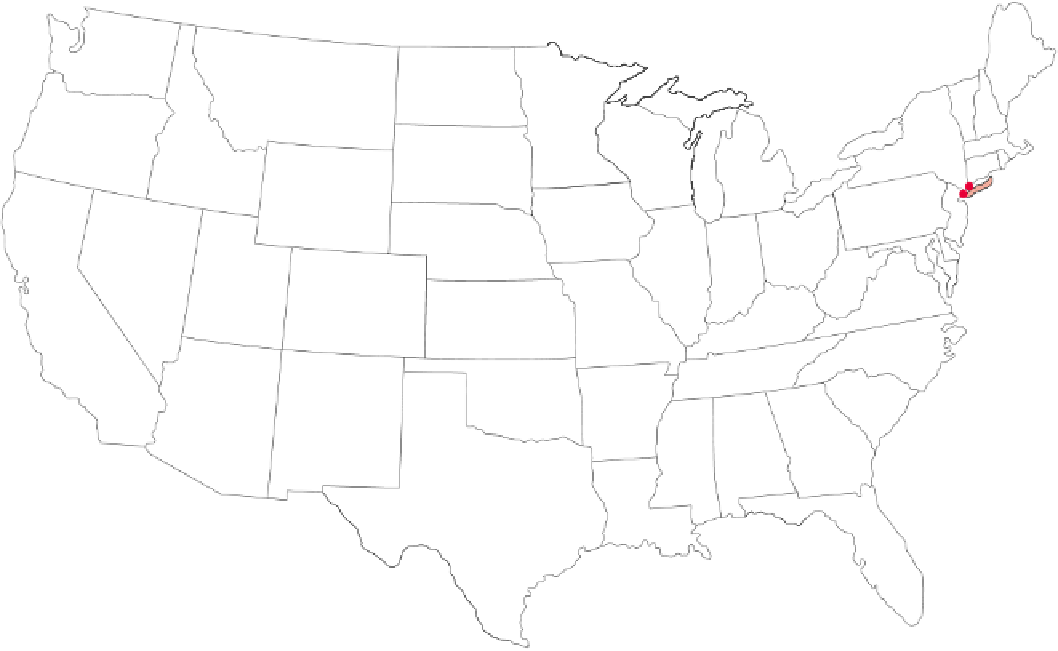
Figure 15-7
Natural capital degradation:
pH values from field measurements at 250 sites (red dots) in 48
states in 2002. Yellow, tan, and orange indicate the areas with lowest pH (highest acidity). Red dots show major
sources of sulfur dioxide (SO
2
) emissions, mostly large coal-burning power plants. The damaging acidic rain
and snow that fall in the Northeast result from coal-fired power and industrial plants and cars in the region and
from pollution that blows in from such plants in the Midwest. In the East, the primary component of acid deposi-
tion is H
2
SO
4
(formed from SO
2
emitted by coal-burning plants). In the West, HNO
3
predominates (formed
mostly from NO
x
emissions from motor vehicles). According to the EPA, two-thirds of the SO
2
and one-fourth of
the NO
x
that are the primary causes of acid deposition come from coal-burning power plants. (Data from Na-
tional Atmospheric Deposition Program/National Trends Network, 2003)
certain other national parks is so smoggy from sulfate
particles and other pollutants that visitors cannot see
the magnificent vistas.
Acid deposition has harmful ecological effects on
aquatic systems as well. Most fish cannot survive in
water with a pH less than 4.5. Acid deposition can also
release aluminum ions (Al
3
) attached to minerals in
nearby soil into lakes. These ions asphyxiate many
kinds of fish by stimulating excessive mucus forma-
tion, which clogs their gills.
Because of excess acidity, several thousand lakes in
Norway and Sweden contain no fish, and many more
lakes there have lost most of their acid-neutralizing ca-
pacity. In Canada, at least 1,200 acidified lakes contain
few if any fish, and fish populations in thousands more
lakes are declining because of increased acidity. In the
United States, several hundred lakes (most in the
Northeast) are threatened with excess acidity. Acid de-
position is not always the main culprit, however. Some
lakes are acidic because they are surrounded by natu-
rally acidic soils.
Acid deposition (often along with other air pollu-
tants such as ozone) can harm forests and crops—espe-
cially when the soil pH falls below 5.1—by leaching es-
sential plant nutrients such as calcium and magnesium
salts from soils. This reduces plant productivity and
the soils' ability to buffer or neutralize acidic inputs.
Acid deposition rarely kills trees directly, but can
weaken them and leave them vulnerable to stresses
such as severe cold, diseases, insect attacks, drought,
and harmful mosses. Effects of acid deposition on
trees and other plants are caused partly by chemical
interactions in forest and cropland soils (Figure 15-9,
p. 356).
Mountaintop forests are the terrestrial areas hard-
est hit by acid deposition (Figure 15-10, p. 356). They
tend to have thin soils without much buffering capac-
ity, and trees on mountaintops (especially conifers