Environmental Engineering Reference
In-Depth Information
of nonrenewable mineral resources. Instead, they claim
that the major problem is the environmental damage
caused by their extraction, processing, and conversion
to products (Figure 12-12).
The environmental impacts from mining an ore
are affected by its percentage of metal content, or
grade.
The more accessible and higher-grade ores are
usually exploited first. As they are depleted, it takes
more money, energy, water, and other materials to ex-
ploit lower-grade ores. This, in turn, increases land
disruption, mining waste, and pollution.
For example, gold miners typically remove an
amount of ore equal to the weight of 50 automobiles to
extract a piece of gold that would fit inside your
clenched fist. Most newlyweds would be surprised to
know that about 5.5 metric tons (6 tons) of mining
waste was created to make their two gold wedding
rings. In Australia and North America, a mining tech-
nology called
cyanide heap leaching
is cheap enough to
allow mining companies to level entire mountains
containing very low-grade gold ore.
Currently, most of the harmful environmental
costs of mining and processing minerals are not in-
cluded in the prices for processed metals and the re-
sulting consumer products. Instead, these costs are
passed on to society and future generations, which
gives mining companies and manufacturers little in-
centive to reduce resource waste and pollution. Envi-
ronmentalists and some economists call for phasing in
full-cost pricing
—including the cost of environmental
harm done in the price of goods made from minerals.
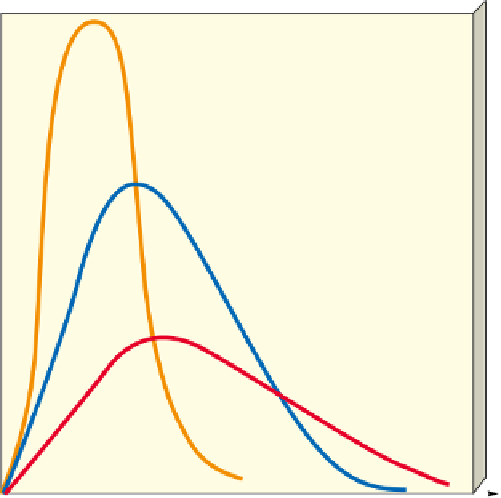
Depletion time
is how long it takes to use up a
certain proportion—usually 80%—of the reserves of a
mineral at a given rate of use. When experts disagree
about depletion times, it is often because they are us-
ing different assumptions about supply and rate of use
(Figure 12-14).
The shortest depletion time assumes no recycling
or reuse and no increase in reserves (curve A, Figure 12-
14). A longer depletion time assumes that recycling will
stretch existing reserves and that better mining tech-
nology, higher prices, and new discoveries will in-
crease reserves (curve B, Figure 12-14). An even longer
depletion time assumes that new discoveries will fur-
ther expand reserves and that recycling, reuse, and re-
duced consumption will extend supplies (curve C, Fig-
ure 12-14). Finding a substitute for a resource leads to a
new set of depletion curves for the new resource.
We can use geological methods to make fairly good
estimates of the reserves of most resources (Figure 12-7,
blue) and less accurate measurements of potential
other supplies of mineral resources (Figure 12-7, red).
Rising prices and improved mining technology can
convert some of the other resources to reserves, but it is
difficult to project how much this conversion will add
to the usable supply.
The demand for mineral resources is increasing at
a rapid rate as more people consume more stuff. For
example, since 1940 Americans alone have used up as
A
Mine, use, throw away;
no new discoveries;
rising prices
x
H
OW
W
OULD
Y
OU
V
OTE
?
Should market prices of goods
made from minerals include their harmful environmental
costs? Cast your vote online at http://biology.brookscole.com
/miller11.
Recycle; increase reserves
by improved mining
technology, higher prices,
and new discoveries
B
12-6 SUPPLIES OF MINERAL
RESOURCES
Recycle, reuse, reduce
consumption; increase
reserves by improved
mining technology,
higher prices, and
new discoveries
Science and Economics: Supplies of
Nonrenewable Mineral Resources
The future supply of a resource depends on how
available and affordable it is and how rapidly that
supply is used.
The future supply of nonrenewable minerals depends
on two factors: the actual or potential supply of the
mineral and the rate at which we use it.
We never completely run out of any mineral. How-
ever, a mineral becomes
economically depleted
when it
costs more to find, extract, transport, and process the
remaining deposit than it is worth. At that point, there
are five choices:
recycle or reuse existing supplies, waste
less, use less, find a substitute,
or
do without.
C
Present
Depletion
time A
Depletion
time B
Depletion
time C
Time
Figure 12-14
Natural capital depletion:
depletion curves
for a
nonrenewable resource (such as aluminum or copper) using three
sets of assumptions. Dashed vertical lines represent times when 80%
depletion occurs.