Environmental Engineering Reference
In-Depth Information
2005 and 2030, the world's urban population is pro-
jected to increase from 3.1 billion to 5 billion. Almost
all of this growth will occur in already overcrowded
cities in developing countries (Figure 7-13).
Second,
the number of large cities is mushrooming.
In
2005, more than 400 cities had 1 million or more people,
and this number is projected to increase to 564 cities by
2015. Today 18
megacities
or
meagalopolises
(up from 8 in
1985) are home to 10 million or more people each—
most of them in developing countries (Figure 7-13). As
they grow and sprawl outward, separate urban areas
may merge to form a
megalopolis.
For example, the re-
maining open space between Boston, Massachusetts,
and Washington, D.C., is rapidly urbanizing and coa-
lescing. The result is an almost 800-kilometer-long
(500-mile-long) urban area that is sometimes called
Bowash
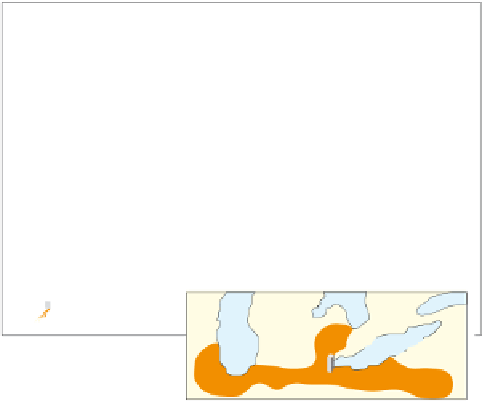
(Figure 7-14).
Third,
the urban population is increasing rapidly
in developing countries.
Between 2005 and 2030, the
percentage of people living in urban areas in develop-
ing countries is expected to increase from 41% to 56%.
Fourth
, urban growth is much slower in developed
countries
(with 76% urbanization)
than in developing
countries.
Developed countries are projected to reach
84% urbanization by 2030.
Fifth,
poverty is becoming increasingly urbanized as
more poor people migrate from rural to urban areas, mostly
in developing countries.
The United Nations estimates
Boston
Springfield
Hartford
Providence
Newark
Allentown
New York
Harrisburg
Baltimore
Philadelphia
Washington
Detroit
Cleveland
Pittsburgh
Bowash
(Boston to
Washington)
Toledo
Chicago
Akron
Chipitts
(Chicago to Pittsburgh)
Figure 7-14
Two megalopolises:
Bowash,
consisting of urban
sprawl and coalescence between Boston and Washington,
D.C., and
Chipitts,
extending from Chicago to Pittsburgh.
that at least 1 billion people live in crowded
slums
(ten-
ements and rooming houses where 3-6 people live in a
single room) of central cities and in
squatter settlements
and
shantytowns
(where people build shacks from
scavenged building materials) that surround the out-
skirts of most cities in developing countries.
Karachi
10.4 million
16.2 million
Dhaka
13.2 million
22.8 million
Beijing
10.8 million
11.7 million
Tokyo
26.5 million
27.2 million
New York
16.8 million
17.9 million
Cairo
10.5 million
11.5 million
Los Angeles
13.3 million
14.5 million
Mumbai
(Bombay)
16.5 million
22.6 million
Osaka
11.0 million
11.0 million
Calcutta
13.3 million
16.7 million
Mexico City
18.3 million
20.4 million
Sao Paulo
18.3 million
21.2 million
Manila
10.1 million
11.5 million
Lagos
12.2 million
24.4 million
Jakarta
11.4 million
17.3 million
Delhi
13.0 million
20.9 million
Shanghai
12.8 million
13.6 million
Key
2004 (estimated)
2015 (projected)
Buenos Aires
12.1 million
13.2 million
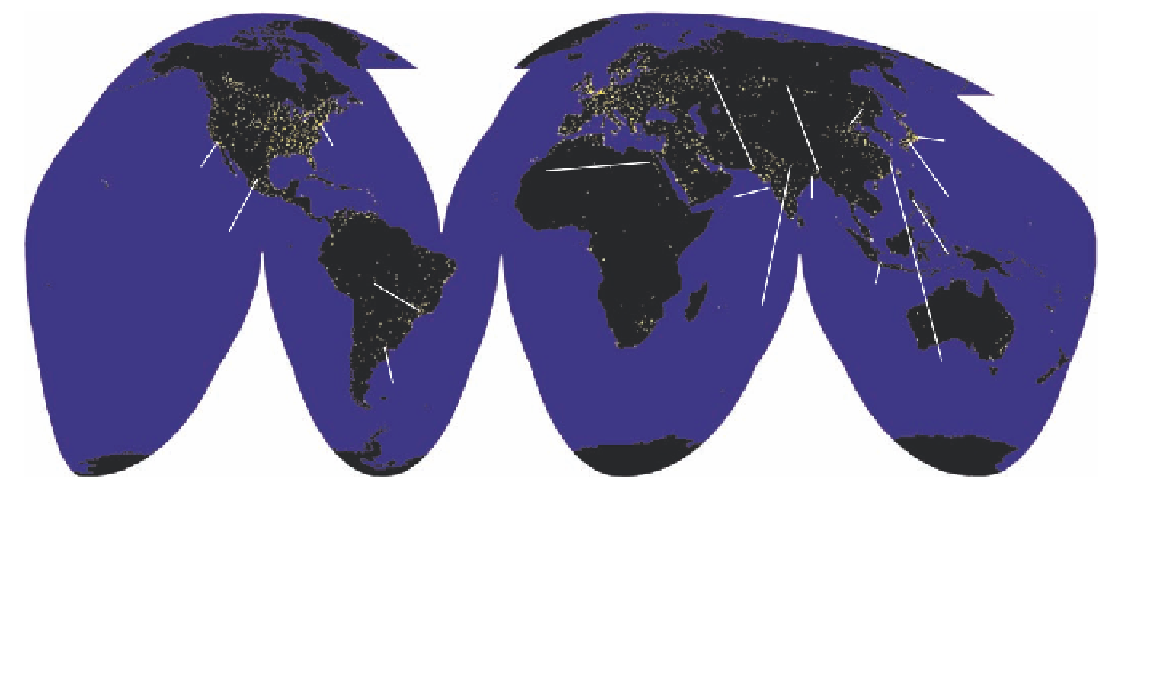
Figure 7-13
Global outlook:
major urban areas throughout the world based on satellite images of the earth at
night that show city lights. Currently, the 48% of the world's people living in urban areas occupy about 2% of
the earth's land area. Note that most of the world's urban areas are found along the coasts of continents, and
most of Africa and much of the interior of South America, Asia, and Australia are dark at night. This figure also
shows the populations of the world's 18
megacities
with 10 or more million people in 2004, and their projected
populations in 2015. All but four are located in developing countries. (Data from National Geophysics Data
Center, National Oceanic and Atmospheric Administration, and United Nations)