Environmental Engineering Reference
In-Depth Information
United States (highly developed)
Brazil (moderately developed)
Nigeria (less developed)
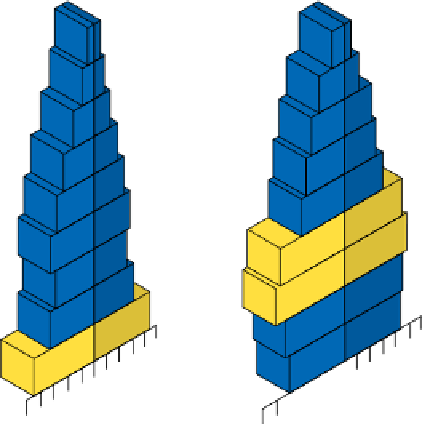
Examine how the baby boom affects the U.S. age structure
over several decades at Environmental ScienceNow.
Population
(2005)
296 million
Economics: Rapid Population Decline
from Reduced Fertility
Rapid population decline can lead to long-lasting
economic and social problems.
The populations of most countries are projected to
grow throughout most of this century. By 2005, how-
ever, 40 countries had populations that were either
stable (annual growth rates at or below 0.3%) or declin-
ing. All, except Japan, are in Europe. Thus about 14% of
humanity (896 million people) lives in countries with
stable or declining populations. By 2050, according to
the UN, the population size of most developed coun-
tries (but not the United States) will have stabilized.
As the age structure of the world's population
changes and the percentage of people age 60 or older
increases, more countries will begin experiencing pop-
ulation declines. If population decline is gradual, its
harmful effects usually can be managed.
However, rapid population decline can lead to
severe economic and social problems. A country that
experiences a “baby bust” or a “birth dearth” has a
sharp rise in the proportion of older people. They
consume an increasingly larger share of medical care,
social security funds, and other costly public services
funded by an ever smaller number of working tax-
payers. Such countries can also face labor shortages
unless they rely more heavily on automation or immi-
gration of foreign workers.
184 million
132 million
457
million
Population
projected
(2050)
260 million
258 million
Infant
mortality
rate
6.6
27
100
Life
expectancy
78 years
71 years
44 years
Total fertility
rate (TFR)
2.0
2.4
5.9
%Population
under
age 15
21%
29%
43%
%Population
over
age 65
12%
6%
3%
Per capita
GDP PPP
$37,750
$7,510
$900
Figure 7-9
Global outlook:
comparison of key demographic
indicators in highly developed (United States), moderately
developed (Brazil), and less developed (Nigeria) countries in
2005. (Data from Population Reference Bureau)
Age
Age
Age
Age
8
0
+
8
0
+
Females
Males
Females
Males
Females
Males
Females
Males
8
0
+
8
0
+
7
0
7
0
7
0
7
0
6
0
6
0
6
0
6
0
6
0
5
0
5
0
5
0
5
0
4
0
4
0
4
0
4
0
3
0
3
0
3
0
3
0
2
0
2
0
2
0
2
0
1
0
1
0
1
0
1
0
24
24
24
12
16
20
12
16
20
12
16
20
12
16
20
0
0
0
0
8
8
8
8
4
4
4
4
1955
1985
2015
2035
4
4
4
4
20
16
12
8
20
16
12
8
20
16
12
8
20
16
12
8
24
24
24
Active Figure 7-10
Tracking the baby-boom generation in the United States.
See an animation based on this
figure and take a short quiz on the concept.
(Data from Population Reference Bureau and U.S. Census Bureau)