Environmental Engineering Reference
In-Depth Information
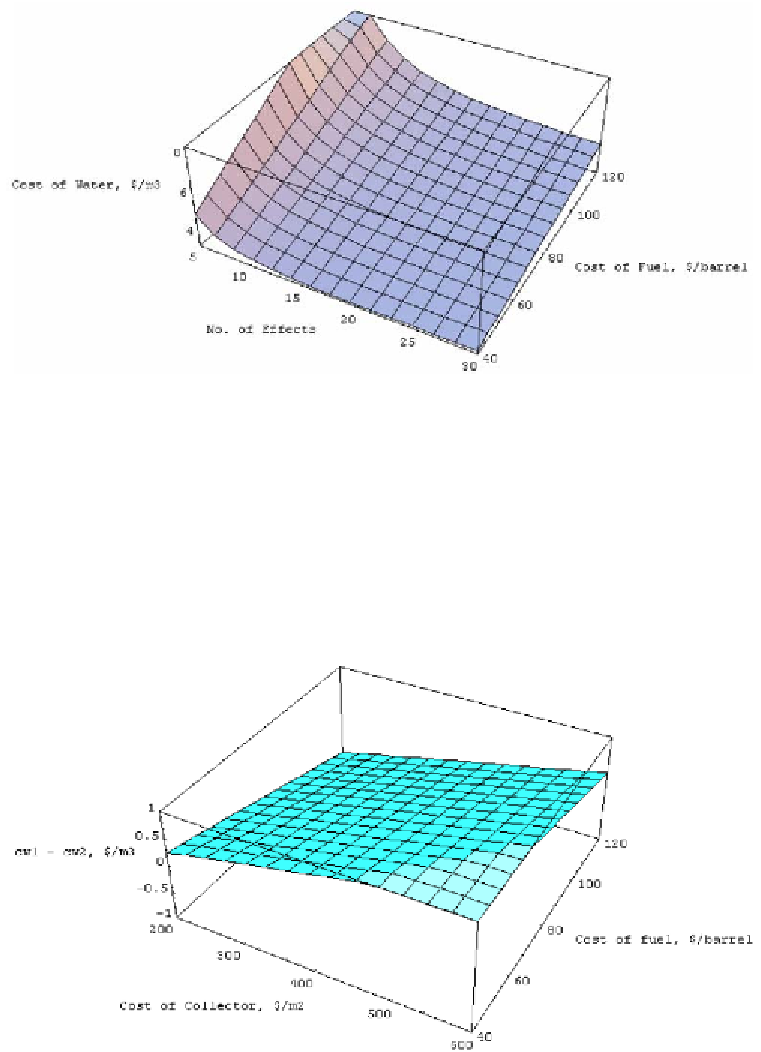
Figure 36. Effect of the number of effects and the cost of fuel on the resulting cost of water - max.
brine temp., T
b
= 90
o
C (conventional MED plant capacity = 130 m
3
/day).
The difference between the cost of water of a solar MED plant (
c
w1
) and the
corresponding cost of a conventional MED plant (
c
w2
) is shown in figure 37 for a capacity of
130 m
3
/day and for different collector and fuel costs. It can be seen that for higher fuel costs
and lower collector costs the difference (
c
w1
-
c
w2
) is negative indicating that the cost of water
from a solar MED plant is cheaper than that of a conventional MED plant having the same
capacity.
Figure 37. Difference in cost of water between solar MED plant, cw1, and conventional MED plant,
cw2 , (cw1 - cw2) ,$/m
3.

Search WWH ::

Custom Search