Environmental Engineering Reference
In-Depth Information
7.3. Evaporating System
7.3.1. Evaporator Performance
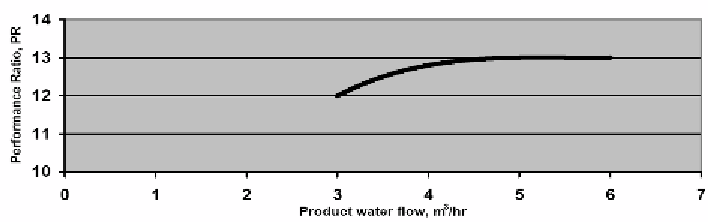
The performance ratio (
PR
) is defined here as the amount of product water produced by
the evaporator per 526 kcal of heat supplied by the heating water. Table 12 shows the average
PR
values and average specific heat consumption for several months during the first year of
the test plant operation. The effect of the product water flow rate on the
PR
is shown in figure
15 which is based on actual tests carried out during plant commissioning in November 1984.
Table 12. Performance ratio of the evaporator
Product water flow
m
3
/hr
Specific heat consumption
kcal/kg
Month
Performance Ratio
Jan. 1985
4.6
40.71
12.9
Feb. 1985
5.3
39.04
13.5
Mar. 1985
5.0
39.31
13.4
Apr. 1985
5.2
38.83
13.5
May 1985
5.0
39.04
13.5
Jun. 1985
5.1
39.98
13.2
Sep. 1985
4.9
40.31
13.0
Figure 15. Performance Ratio versus product water flow.
Overall Heat Transfer Coefficients
The overall heat transfer coefficients (OHTC) shown in figure 16 are estimated from
the measured temperatures and flow rates. Shown in this figure are the average HTC for the
evaporators, the average OHTC of the preheaters and the OHTC of the heater (first effect)
and condenser. The evaporators are heat exchangers in which vapor is condensed inside
tubes while seawater brine boils on the outside of the tubes. These heat exchangers have the
highest OHTC compared with the other heat exchangers as shown in the figure. The data
shown in this figure represent typical values of the OHTC,s obtained during the first year of
plant operation. Some deterioration in the OHTC's has occurred during the subsequent


Search WWH ::

Custom Search