Environmental Engineering Reference
In-Depth Information
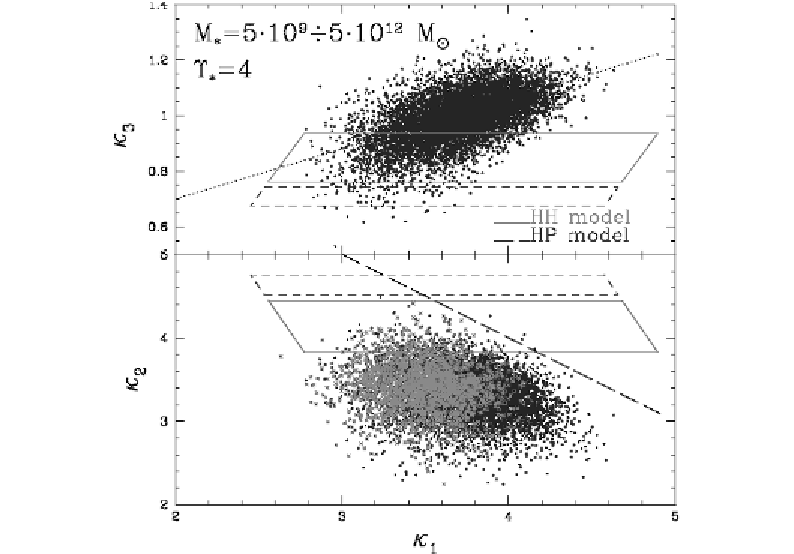
Figure 6. Comparison between observations and model predictions in the Κ-space FP for
ETGs within the mass range,
5 10
9
≤
M
∗
/M
⊙
≤5 10
12
, assuming
Υ
∗
= 4
. The DR1-
SLOAN survey in R
∗
band is represented by dots, and the best fitting relation by a dotted
line (top panel). The dashed line (bottom panel) is an empirical border line which seems
not to be violated by any gravitationally bound astrophysical object. Full and dashed line
parallelograms show the coverage of HH and HP models, respectively. ETGs matched by
HH and HP models in the Κ
1
-Κ
3
plane (top panel) are represented by starred points in the
Κ
1
-Κ
2
plane (bottom panel). Data from observations cannot be entirely matched by MVPE
configurations in both planes.
The third point means that the MVPE configurations, according to Eq. (
??
), are defined
by the pair
(
Β
)
, regardless of the total mass, M
=
M
∗
+
M
h
. To describe the FP
tilt, a relation between total mass (
∝
Κ
1
) and total mass-to-light ratio (
∝
Κ
3
) is needed. In
conclusion the FP tilt cannot be explained, in the light of the
energy-conservation paradigm
,
by MVPE configurations, assuming a constant
Υ
∗
.
R
,
4.2.
Testing with
N
−
Body Simulations
The aim of the current subsection is to see to what extent MVPE configurations, within
the
energy-conservation paradigm
, can be preferred final states of the transition from ear-
lier non-virialized states, e.g. at turnaround. Keeping in mind that star formation processes,
energy feedback, implementation and hierarchical merging are of extreme interest in the
analysis of galaxy assembly processes, further attention shall be devoted to the evolution
Search WWH ::

Custom Search