Environmental Engineering Reference
In-Depth Information
The objective function values for different values of
CAP
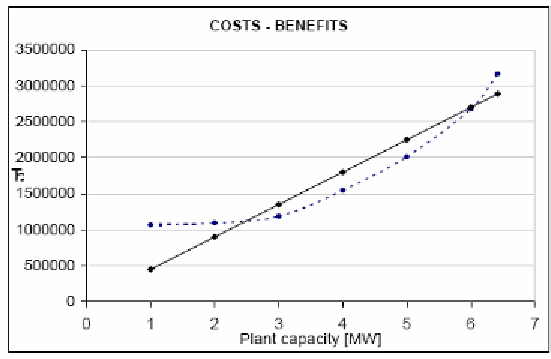
are reported in figure 2.4. In
particular, in the same figure, together with costs, are reported the benefits (calculated taking
into account the produced energy) for the different plant capacities.
From a cost-benefit
analysis, comparing the costs curve with the benefits line, coming from the sales of produced
energy, it comes out that a reasonable benefit is obtained for a plant with capacity between 4
and 5
MW
. Further analysis have then been performed on a plant with a capacity of 5
MW
. In
fact, from the analysis of previous results, it can be said that the availability of forest biomass
and other typologies of biomass (discards of primary workmanship of the wood and prunings
of the public green) allows the installation of a plant with power equal to 5 MW.
In table 2.3 is reported the optimal solution for a plant capacity equal to 5 MW. The used
forest parcels are the 50% (in number of 192) of the total forest parcels (374).
Then, in order to better qualify the obtained results and the sustainability of the plant, an
evaluation of the produced emissions has been performed, and in particular of those emissions
produced by the vehicles used for the biomass transport. In order to move the biomass from
the single forest parcel to the plant, camions able to take 20 tons of material, with diesel
engine, have been considered. Once the number of necessary vehicles has been calculated, on
the basis of the distance among each parcel and the plant, it has been possible to calculate the
pollutant emissions in the atmosphere due to transport operations.
Figure. 2.4. Cost-benefits analysis for every plant capacity .
Table 2.3. Biomass exploitation scenario for CAP = 5 MW
Used biomass
MW
5
m
3
86418
%Industrial scraps
100%
% Used forest biomass
1,7%
Parcels number
192


Search WWH ::

Custom Search