Environmental Engineering Reference
In-Depth Information
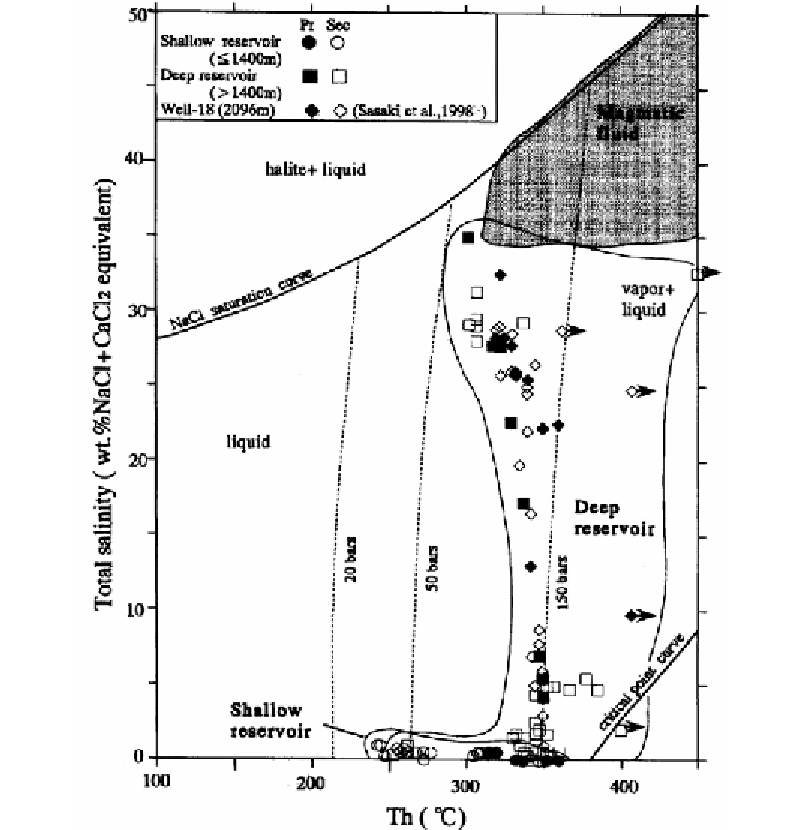
Figure 18. Variation of total salinities with homogenization temperatures (Th) of fluid inclusions in
anhydrites from the Kakkonda geothermal field (Muramatsu et al., 2000) The Pr and Sec indicate
primary and secondary inclusions, respectively. Short arrows indicate that the Th values were obtained
as minimum estimates. The NaCl saturation curve and critical point curve were drawn for the system
NaCl-H
2
O after Sterner et al. (1988) and Bischoff and Pitzer (1989), respectively. The isobaric curves
at pressures of 20 and 50 bars are after Haas (1976), and 150 bars after Sourirajan and Kennedy (1962).
4. Conclusion
Fluid inclusion trapped ancient to present reservoir fluid in transparent mineral offers us
information about the change of the physicochemical properties such as temperature, salinity
and chemical composition of the fluid in geothermal fields. The minimum Th value can be
used to estimate the reservoir temperature with real time at a development site in most

Search WWH ::

Custom Search