Database Reference
In-Depth Information
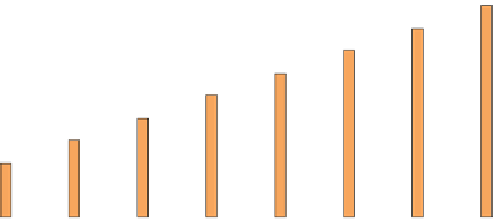
For a finer-grain data split, MARLA improves performance when the first
25 % of the cluster is upgraded, but subsequent upgrades to 50 % and 75 % do
not yield performance gains. Only when the entire cluster runs Faster nodes do
we see the next level of application performance improvement.
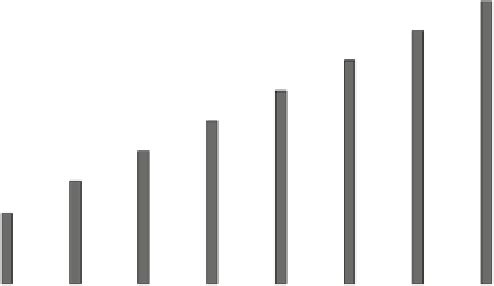
Fig. 5.
This graph displays the results of our experiments when we follow a four tasks
per worker splitting rule across our cluster as we incrementally perform upgrades. On
the X-axis is the number of matrices multiplied during the test. On the Y-axis is the
relative time each incremental upgrade takes with respect to the un-upgraded cluster.
We plotted but did not include results for the 32-tasks (2 per node) and
48-tasks (3 per node) versions of Figs.
1
and
5
. The two omitted graphs plot data
whose values closely approximates the data for Fig.
1
. For example, runtimes are
only slightly longer in all cases for the 2 tasks-per-node experiments (on average,
values are 1.75 % longer and each individual value is within 4 % of its counter-
part). The small increase reflects the small overhead of worker nodes requesting
extra work rather than receiving it in the initial split. Figure
6
, described next,
adequately demonstrates the similarity of the data for the omitted graphs.
5.4 Matrices per Second
As problem sizes grow linearly (e.g. the x-axis in Figs.
1
and
5
, the average run-
time for each set of tests also grows linearly. To view more data in one place,
and to highlight the effect of performance-heterogeneity and split granularity
across all tests, Fig.
6
plots the average number of matrices multiplied per sec-
ond, for all six cluster configurations paired with all four split granularities.
Bars corresponding to the Baseline homogeneous (0 % Faster) and the 25 % and


Search WWH ::

Custom Search