Environmental Engineering Reference
In-Depth Information
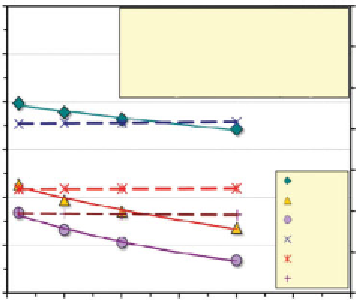
the variation of the mobility of the positive ion (e.g., H
+
, K
+
, Na
+
) of the
1,1 valence electrolytes HCl, KNO
3
and NaCl in aqueous solutions at
room temperature were computed according to Equation 2.12, where Λ
v
is
described by the “Kohlrausch square root law.” These relations are plotted
in Figure 2.6. The variation of the transference numbers of the cations with
concentration are also plotted to discern its effect on the mobility of each
ion. As observed, the reduction of the mobility of each ion with increasing
concentration appears to be mostly dependent on Λ
v
.
The Cao-model was used to predict the spatial and temporal distribu-
tions of four ionic species, Pb
+2
, NO
3
-
, H
+
and OH
-
in kaolinite clay. Four
one-dimensional advection-dispersion equations were solved simulta-
neously, one for each ionic species. Changes in electrical potential, con-
ductivity and field strength were considered in the solutions. Figures 2.7
present the spatial distribution of the total lead and the pH for 35 day runs
of Cao-model. Superimposed on the numerical solutions are results from
the laboratory tests of Pb(NO
3
) contaminated kaolinite clay subjected to
long-term electrokinetic treatment. The 35-day lead and pH distribution is
predicted well by the model, including the accumulation of the metal in a
narrow zone adjacent to the cathode
. The model predictions of the 15-day
and the 35-day distribution of lead concentration indicate that migration
velocity of the ions become affected by the electrical field distribution over
time. The reduction in electrical conductivity at the cathode zone results in
higher electrical field in that region. The high electrical gradient hurls the
1.4
1.2
Ionic Properties at Infinite Dilution, *
Λ
(cm
2
s
1
V
-1
)
(cm
2
Ohm
-1
equiv
-1
)
u
1.2
H
+
K
+
Na
+
* Source: (Bard and Faulkner, 1980)
10
-3
349.82
73.52
50.11
3.625
×
1.0
10
-4
73.52
50.11
7.619
×
10
-4
5.193
×
1
0.8
0.8
0.6
0.6
HCL
KNO3
NaCl
t of H+
t of K+
t of Na+
0.4
0.4
0.2
0.2
0
0.0
0
0.05
0.1 0.15 0.2
Concentration of Ion, M
0.25
0.3
Figure 2.6
Variation of mobility and transference with concentration of selected ions
(Pamukcu, 2009)


Search WWH ::

Custom Search