Environmental Engineering Reference
In-Depth Information
200
KS (I)
KS (h)
KG (h)
KH (h)
SS (h)
MS (I)
MS (h)
SSRM
Cd
+2
K
ef
= 0.12
[Cd
+2
] ~ 0.0002 M
K
ef
= 0.05
[Cd
+2
] ~ 0.006 M
160
K
ef
= 0.05
[Cd
+2
] ~ 0.008 M
120
80
K
ef
= 0.015
[Cd
+2
] ~ 0.04 M
40
K
ef
= 0.008; Synthetic Soil
Reference Matrix (SSRM)
0
0
2000 4000
Cumulative Electrical Charge, C
6000
8000
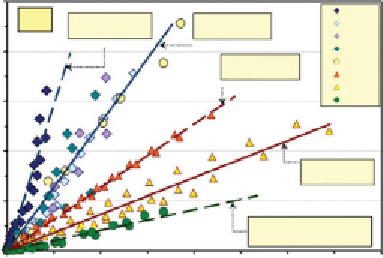
Figure 2.2
Variation of Cumulative Flow with Electric Charge (Pamukcu and Wittle,
1992; Pamukcu, 2009)
0.5
0.15
Average values
K
ef-blank
KS = 0.14
K
ef-blank
MS = 0.04
0.425
0.4
0.359
0.364
0.12
0.3
0.09
0.2
0.06
0.03
0.1
0
0
Cs+
Cs+2
Major contributing ion in clay
Cs+
Cr+3
Pb+2
Zn+2
KS
MS
KG
KH
SS
Molar Concentration
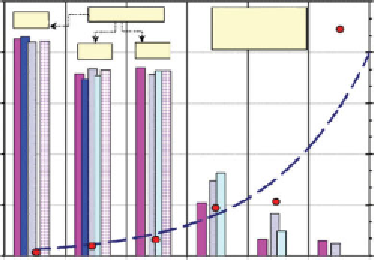
Figure 2.3
Variation of measured K
ef
factors with ion and soil type at same concentration
(Pamukcu and Wittle, 1992; Pamukcu, 2009)
treatise further strengthens the validity of these assumptions. Figure 2.3
presents the variation of the measured
K
ef
for all soils and six selected major
contributing ions (Cd, Cs, Cr, Pb, Sr and Zn) in the bulk fluid, all applied
separately. There is a clear trend of decreasing
K
ef
factor with increasing
ion concentration, where the normalized
K
ef
of different soil types with
similar molar concentration cohort of different ions are shown. The values
are normalized by the measured
K
ef
values of the respective “blank” clays,
those that were mixed and consolidated only with distilled water. At low


Search WWH ::

Custom Search