Environmental Engineering Reference
In-Depth Information
5000
Viscosity = -65.444Days + 4520.345
California Heavy Crude BB
California Heavy Crude EE
4000
3000
2000
Viscosity = -23.718Days + 2635.115
1000
0
0
10
20 30
Days of Electrochemical Treatment
40
50
60
Figure 3.26
California, USA, Heavy Crude viscosity changes during DCEOR laboratory
tests (after Wittle et al., 2008a, 2008b, 2008c, & 2011)
1.0E-04
Start of EO at 5VDC
@ 4265 min
1.0E-05
EO at
10VDC
EO at
35VDC
Hydraulic gradient
1.0E-06
Hydraulic gradient
1.0E-07
0
2000
4000
Time, min
6000
8000
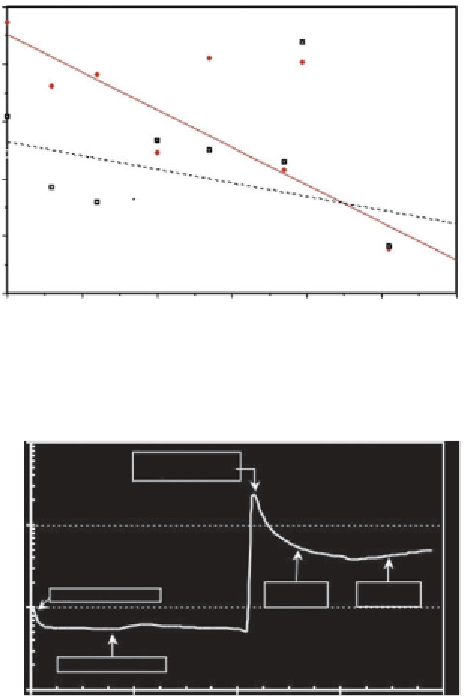
Figure 3.27
Changes in effective permeability, due to the passage of DC current (after,
Pamukcu, and Pervizpour, 1997)
3.12.1
Electrokinetics and Effective Permeability
Figure 3.27 illustrates the effect of DC current application on fluid flow
in a micro-darcy fine grained silty-clay. The effective permeability, in this
laboratory test, increases 1 to 1.5 orders of magnitude, when electrical
current is applied. This is consistent with the approximately 60m rise in
the fluid level of a monitoring well, during the Lloydminster Heavy Oil
Belt, DCEOR field demonstration, and the USC electro-osmosis results
described earlier and with the results of Chilingar et al. (1970).


Search WWH ::

Custom Search