Environmental Engineering Reference
In-Depth Information
3000000
2500000
2000000
1500000
1000000
500000
0
6.00
8.00 10.00 12.00 14.00 16.00 18.00 20.00 22.00 24.00 26.00 28.00 30.00 32.00 34.00 36.00 38.00 40.00 42.00 44.00 46.00 48.00
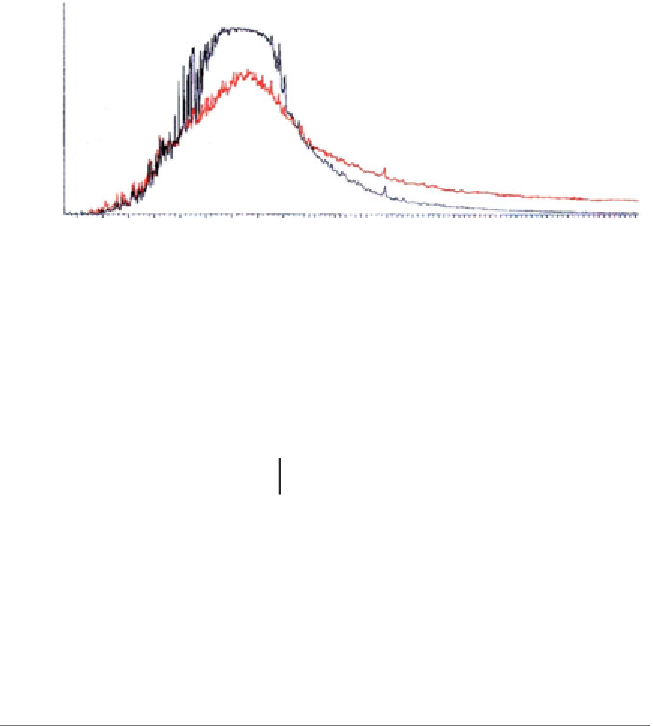
Figure 3.25
Laboratory San Joaquin Valley (California, USA) heavy oil field reservoir
rock laboratory DCEOR test (after Wittle and Hill, 2006a & 2006b; Wittle, et al., 2008a,
2008b, 2008c, & 2011). GCMS Spectra: Vertical axis is abundance, while horizontal axis
is retention time (corresponding to HC complexity) in minutes. Red curve - start of test.
Black curve - after 74 days of DCEOR.
Table 3.7
California heavy oil field reservoir (rock and crude) laboratory test
GCMS results
GCMS Spectra Property
Base Line Sample
74 Day Sample
Spectra Peak abundance
2,100,000
2,750,000
Spectra Peak Location (min)
19.05
18.40
Spectra Peak Half-Width
Abundance
1,050,000
1,375,000
Spectra Peak Half Width (min)
13.2 - 24.5
14.45 - 22.9
Spectra Tail
Extensive to 49 min
Insignificant after
30 min
DCEOR treatment. As with the case, for the ECGO PAH remediation, the
samples for the spectras in figure 3.25
were not
collected at the cathode,
but from the ~ 1 m
3
sample.
Figure 3.26 shows viscosity changes during similar large volume
DCEOR laboratory tests, involving crudes from two California heavy oil
fields. There are significant declines in viscosity (at constant temperature)
for both of these crudes, during the course of the tests.
The results shown in figures 3.25 and 3.26 are consistent with the Santa
Maria Basin Lloydminster, and Golfo San Jorge Basin field DCEOR results
as well as the ECGO GCMS spectra of figure 3.24.


Search WWH ::

Custom Search