Environmental Engineering Reference
In-Depth Information
Figure 3.19
DCEOR figure 3.17 model simulation equipotential field plan view (after
Wittle and Hill, 2006; Wittle et al., 2008a, 2008b, 2008c
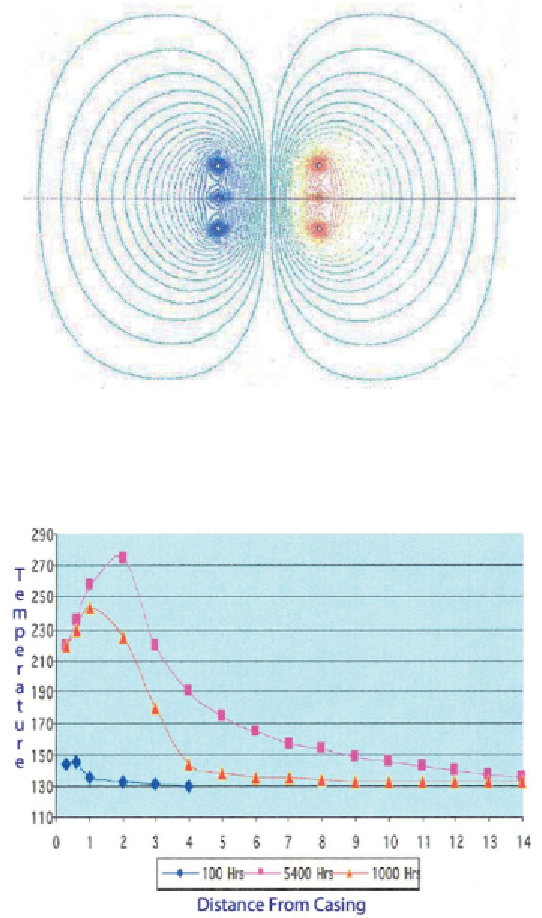
Figure 3.20
DCEOR simulation results: Reservoir temperatures after 100, 1,000, and
5,400 hours of stimulation. temperatures (vertical axis) are in °F and distances (horizontal
axis) are in radial feet, from the Casing (after Wittle and Hill, 2006; Wittle et al., 2008a,
2008b, 2008c)


Search WWH ::

Custom Search