Environmental Engineering Reference
In-Depth Information
100
Control @ 20°C
20°C
80
30°C
40°C
60
Control @ 30°C
40
Control @ 40°C
20
0
ANODE SECTION
CENTER SECTION
CATHODE SECTION
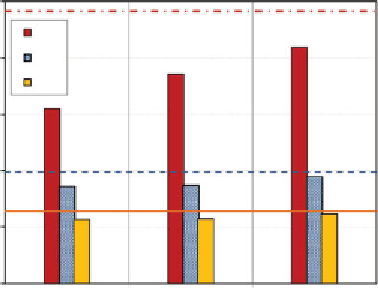
Figure 2.45
The post-test viscosity distribution of
PA
oil cell compared to its control
(Ghazanfari, 2013)
180000
160000
Control @ 40°C
40°C
50°C
60°C
140000
120000
100000
80000
60000
Control @ 50°C
40000
20000
Control @ 60°C
0
ANODE SECTION
CENTER SECTION
CATHODE SECTION
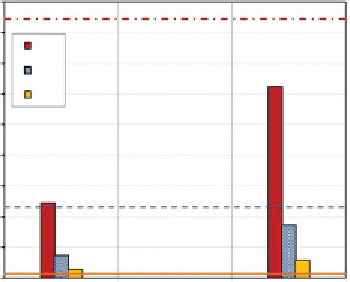
Figure 2.46
The post-test viscosity distribution of
Canadian
oil cell compared to its
control (Ghazanfari, 2013)
viscosity which increased, the SARA analysis of the California oil sample
showed a decrease in saturates and aromatics while a substantial increase
of asphaltenes in the anode region. For the Canadian oil sample, as shown
in Figure 2.48, there was a significant increase in the saturate content and
a significant decrease in the asphaltene content of the oil both at the anode
and cathode regions. The aromatic and the resin contents do not show as
large a change from the control.


Search WWH ::

Custom Search