Environmental Engineering Reference
In-Depth Information
2.4.2
Field Evidence of Oil Extraction
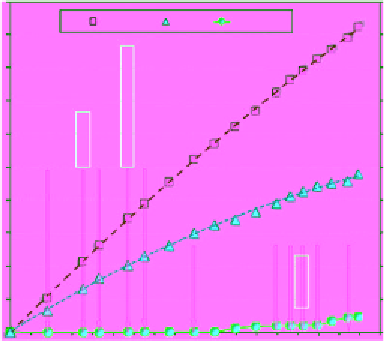
A field application case in the Pennsylvania field was monitored over
time to investigate the effectiveness of electrically enhanced oil recovery
accompanied by water flooding (i.e., water pressure). The cumulative oil
and water production was monitored at one of the production wells for
180 days. During this time, some amount of paraffin was observed to pro-
duce in the well also. The oil, water, and paraffin production over time
are plotted in Figure 2.42. The oil production was about 5% of the water
production and the paraffin production was about 4% of oil production by
volume.
The oil production decreased with time in general, yet there was no
immediate break in oil production when the power was terminated,
reversed or re-applied. This is attributed to the build-up of seepage and
suction pressures with electro-osmosis, which would require time to dis-
sipate in low permeability formations before the low regime change or
subside (Muraoka et al., 2011). Figure 2.43 shows the oil and paraffin pro-
duction over time. As observed, the paraffin production increased with
power and elevated temperature. When the power was turned off the par-
affin production ceased. It is plausible that as pH, ionic concentration and
dissolved minerals (e.g., calcite) increase at the production well (cathode),
it created the ideal conditions for excess oil to transform to paraffin. A sim-
ilar phenomenon was observed in lab experiments of core rock samples
5000
50000
water
Oil
Parain
4500
45000
4000
40000
3500
55000
3000
30000
2500
25000
2000
20000
1500
15000
1000
10000
500
5000
0
0
0
50
100
150
Time (days)
Figure 2.42
Water, oil, and paraffin production (Pennsylvania field) (Ghazanfari, 2013)


Search WWH ::

Custom Search