Environmental Engineering Reference
In-Depth Information
size of green sand and zeolite was on the order of medium to fine sand.
Bentonite was added to enhance the bonding of the matrix. The final water
content of the cap mixture was 37.5%, and of the contaminated soil was
60% with initial Pb(II) concentration of 5000 ppm. A constant voltage of
15 volts was applied to all the test samples. The tests were terminated when
the current readings diminished to a constant low value.
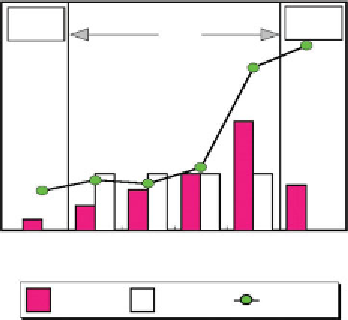
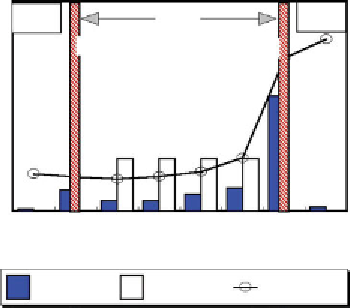
Figures 2.40 and 2.41 show the average pre- and post-EK mass frac-
tion distributions of Pb(II) in the soil and the electrode chambers with
1
14
Water
Chamber
Water
Chamber
12
Soil
0.8
10
0.6
8
6
0.4
4
0.2
2
0
0
Anode
0.40 0.60
Normalized Distance From Anode
0.20
0.80
Cathode
Pre-EK Pb(II)
pH
Post EK Pb(II)
Figure 2.40
Post EK mass fraction (%) of total Pb remaining in soil and liquid tested
without the GS Caps; pH superimposed (Pamukcu et al., 1997)
1
14
12
10
8
6
4
2
0
Water
Chamber
Water
Chamber
Soil
0.8
Cathode Cap
Anode Cap
0.6
0.4
0.2
0
0.60
1.00
Anode
0.20
Electrode Location Along EK Cell
Post EK Pb(II)
Pre EK Pb(II)
pH
Figure 2.41
Post EK mass fraction (%) of total Pb remaining in soil and liquid tested with
the GS Caps; pH superimposed (Pamukcu et al., 1997)


Search WWH ::

Custom Search