Biology Reference
In-Depth Information
A
B
Rabbit ventricle
Rat ventricle
520
Control
+Citrate
550
500
490
500
480
+Citrate
Control
+Citrate
Control
Control
+Citrate
200 ms
100 ms
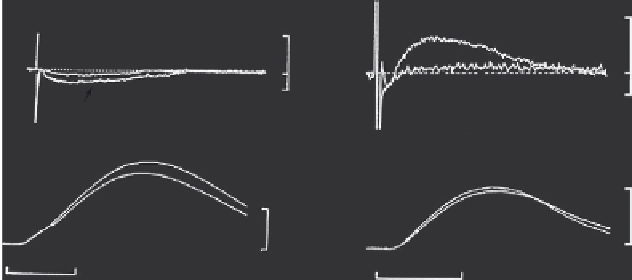
Fig. 5
Measurements of [Ca
2
þ
]
o
with double-barreled Ca
2
þ
-selective MEs during single steady state
contractions in (A) rabbit and (B) rat ventricular muscle (0.5 Hz, 30
C). The [Ca
2
þ
]
o
and tension are
shown in the absence and presence of 10 mM citrate (which limits [Ca
2
þ
]
o
depletion by bu
V
ering
[Ca
2
þ
]
o
. Bath [Ca
2
þ
]
o
¼
0.5 mM (dotted line). Data was from
Shattock & Bers, (1989)
, as presented in
Bers (2001)
(with permission).
2. Measuring Extracellular [Ca
2
þ
] with Double-Barreled MEs
Double-barreled Ca
2
þ
MEs can record rapid changes in extracellular [Ca
2
þ
]
([Ca
2
þ
]
o
) between cells in multicellular preparations such as isolated cardiac tra-
beculae (
Bers, 1983, 1985, 1987; Bers and MacLeod, 1986; Shattock and Bers,
1989
).
Figure 5
A shows that one can detect small [Ca
2
þ
]
o
depletions during
individual steady state rabbit cardiac action potentials and contractions. More-
over, when [Ca
2
þ
]
o
is bu
V
Y
V
er citrate these depletions
can be suppressed. Note that these [Ca
2
þ
]
o
depletions reflect net cellular Ca
2
þ
influx (in excess of e
ered by the low a
nity fast bu
ux) early in the contraction and net Ca
2
þ
e
ux later in the
contraction, such that [Ca
2
þ
]
o
returns to the bath level. In cardiac myocytes the
depletion is driven mainly by Ca
2
þ
influx via Ca
2
þ
channel current and to some
extent by Na
þ
/Ca
2
þ
exchange (which can mediate Ca
2
þ
influx at positive E
m
when
[Ca
2
þ
]
i
is low). As [Ca
2
þ
]
i
rises in the cell during the heartbeat because of Ca
2
þ
entry and SR Ca
2
þ
release, it causes enhanced Ca
2
þ
e
Z
Z
ux (mainly via Na
þ
/Ca
2
þ
exchange in cardiac myocytes), and this allows [Ca
2
þ
]
o
to recover. Note that action
potential repolarization greatly enhances the driving force for Ca
2
þ
e
Z
ux via Na
þ
/
Ca
2
þ
exchange, further enhancing the recovery of [Ca
2
þ
]
o
to the bath level.
In rat ventricular muscle the [Ca
2
þ
]
o
signals are remarkably di
Z
V
erent (
Fig. 5
B).
In the rat there is only a very brief phase of [Ca
2
þ
]
o
depletion (for
20 ms), which
gives way to a large rise in [Ca
2
þ
]
o
during the contraction. At first this result
seemed surprising in light of the rabbit results in
Fig. 5
A. However, when we
consider the di
erences in action potential shape and that [Na
þ
]
i
is higher in rat
ventricular myocytes (
Shattock and Bers, 1989
), the explanation became clear. The
rat (and mouse) ventricle exhibit very short action potential duration compared to
V