Biology Reference
In-Depth Information
100
3
75
Indo-1
2
50
1
25
0
0
Minielectrode
Microelectrode
−
25
−
50
−
75
8
7
6
5
4
3
pCa
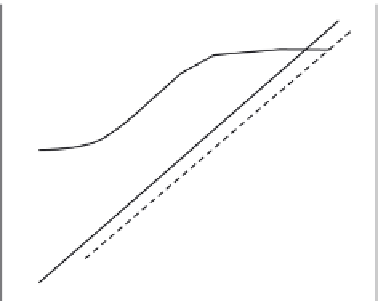
Fig. 1
Dynamic range of Ca
2
þ
-selective electrodes and indo-1. The electrode potential of Ca
2
þ
-
selective mini and MEs is shown together with the fluorescence ratio (400/470) for indo-1. Measure-
ments were performed in a KCl bu
V
er containing 140 mM KCl, 10 mM HEPES, 10 mM NaCl, and
1 mM EGTA. Notice that indo-1 is suitable for measurements between pCa 7.5 and 5, while the
dynamic range for the Ca
2
þ
electrode is wider, ranging from pCa 9 to 1 for minielectrodes and 7.5 to
1 for MEs.
for the Ca
2
þ
-selective ligand), the relationship becomes, for 30
C and changing
to log 10:
þ K
2
pot
30 log Ca
2
þ
NaCa
Na
þ
E
Ca
¼ E
o
þ
½
ð
2
Þ
Thus for the case of no interfering ion and when extracellular Ca
2
þ
¼
[Ca
2
þ
]
ref
,
erent [Ca
2
þ
] reduces
then the potential di
V
erence (
D
E) between two solutions of di
V
to the Nernst equation:
Ca
2
þ
ref
Þ ð
3
Þ
The response of an ion-selective electrode to changes in free [Ca
2
þ
] is much slower
than the fluorescent, bioluminescent, and metallochromic Ca
2
þ
indicators. Thus,
Ca
2
þ
electrodes are ideal for measurements of slow changes over wide ranges of
[Ca
2
þ
], but not appropriate for very rapid changes of free [Ca
2
þ
] although the Ca
2
þ
electrodes can respond in the millisecond range at higher [Ca
2
þ
](
Bers, 1983
). The
response time can also be improved by using Ca
2
þ
selective electrodes with a
concentric inner micropipette that reduces the longitudinal resistance of the
Ca
2
þ
-selective resin and thereby decreases the electrical time constant (
Fedirko
et al., 2006; Ujec et al., 1979
). These limitations, together with the physical size of
Ca
2
þ
-selective electrodes put them at disadvantage with fluorescent and lumines-
cent calcium indicators for measurements of dynamic changes in calcium levels in
Ca
2
þ
=½
DE ¼
ð½
30 log