Biology Reference
In-Depth Information
A
Cleavage period
B
Blastula period
i
AP
view
i
AP
view
Side
view
Side
view
4-cell stage
1 hpf
Sphere stage
4h
ii
EM-CCD
iii
IPD 425
ii
EM-CCD
iii
IPD 425
1
2
3
4
>5
1-2 3-4 5-6
7-8
>9
1
2
3
4
>5
1-2 3-4 5-6
7-8
>9
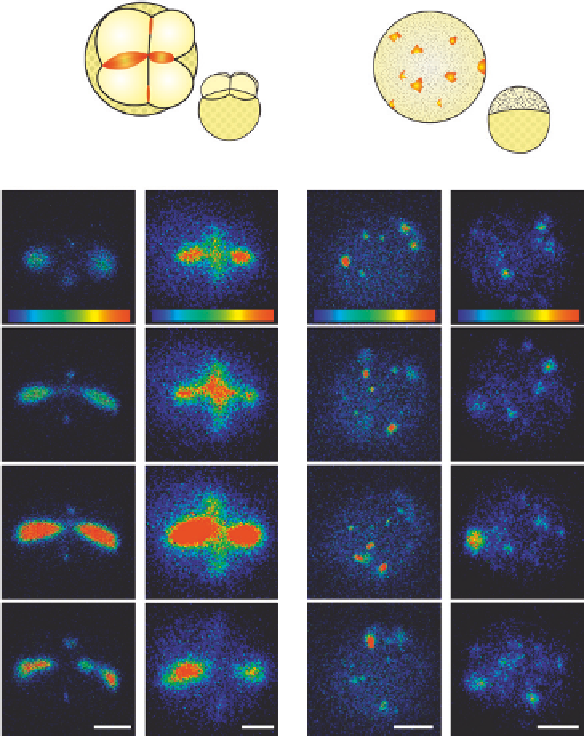
Fig. 5
Comparison of the bioluminescence images acquired by the EMCCD and RA-IPD photon
imaging systems during (A) the Cleavage Period and (B) Blastula Period of zebrafish development. (Ai
and Bi) Schematics of an embryo from a side (animal pole—AP) view and top view at the (Ai) Four-cell stage
(i.e.,
4 hpf ) to show the morphology of the embryo and the typical
patterns of Ca
2
þ
signals (in red) observed at these two stages of development. (Aii, Aiii and Bii, Biii)
Representative AP views of f-aequorin loaded embryos to show the changes in intracellular free Ca
2
þ
that
occur (Aii andAiii) at di
1 hpf) and (Bi) sphere stage (i.e.,
erent times during the second cell division cycle (i.e., two- to four-cell stage) and (Bii
and Biii) at sphere stage. The images were acquired using an Andor EMCCD-based imaging system (Aii and
Bii) and a Photek IPD 425-based imaging system (Aiii and Biii). In both cases, luminescence was accumu-
lated for 30 s. Color scales indicate luminescent flux in photons/sec. Scale bars are 200
m
m.
V