Biology Reference
In-Depth Information
in [Ca
2
þ
] within the cytosol and the various organelles within the cell (e.g.,
nucleus, mitochondria, sarco/endoplasmic reticulum). The two main categories
of molecules used for this purpose are small synthetic organic molecules based
on the fast Ca
2
þ
bu
V
er BAPTA (
Tsien, 1980
) or modified versions of natural
Ca
2
þ
binding proteins (
Miyawaki et al., 2003
). Both categories ''sense'' Ca
2
þ
by
chelating the ion which changes the structure/chemical properties of the ligands.
Several modes of fluorescence have been utilized to report Ca
2
þ
(summarized in
Fig. 7
).
Absorbance/quantum yield: In this case, Ca
2
þ
binding causes a change in the
intensity of the fluorescence from the dye; typically, Ca
2
þ
binding causes an
increase in fluorescence (
Fig. 7
A). This mode is the most common employed by
the fluorescent Ca
2
þ
indicators used in confocal or 2P microscopy. In particular,
A
Quantum yield
B
Spectral shift
+
Ca
+
Ca
−
Ca
−
Ca
Wavelength
Wavelength
Fluorescence life time
C
D
Förster resonance energy transfer
+
Ca
Ca
+
−
Ca
−
Ca
Time (ns)
Wavelength
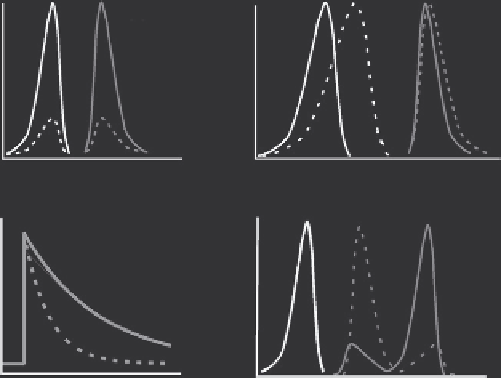
Fig. 7
Major categories of fluorescence properties of Ca
2
þ
indicators. (A) Change in dye absor-
bance and quantum yield generates a Ca
2
þ
-sensitive change in the fluorescence intensity (e.g., Fluo-3/
4 Rhod-2, Oregon Green, and Fura-Red (inverse relationship)). (B) Spectral shift in the excitation
spectrum as a result of Ca
2
þ
binding to an indicator allows ratiometric measurements (e.g., Fura-2/3/
4/6/FF). (C) Changes in fluorescence life time as a result of Ca
2
þ
binding to an indicator; the
fluorescence decays exponentially within ns of the end of excitation. The rate of decay is Ca
2
þ
dependant; for example, the decay of Ca
2
þ
-bound Fluo-3 fluorescence is faster than the decay of
unbound Fluo-3. (D) Change in F¨ rster resonance energy transfer (FRET) efficiency as a result of
Ca
2
þ
binding to either the acceptor or donor proteins; Ca
2
þ
binding changes the distance between the
two linked fluorescent proteins. The distance between the donor and acceptor proteins determines the
degree of FRET; an increase in FRET efficiency causes a decrease in donor fluorescence and an
increase in acceptor fluorescence. Black lines indicate excitation spectra and gray lines indicate
emission spectra. Dotted lines represent the Ca
2
þ
-free form of the dye, whereas solid lines represent
the Ca
2
þ
-bound form of the dye.