Biology Reference
In-Depth Information
C
2.0
23
1
1.0
0.0
0
10
20
Time (min)
30
40
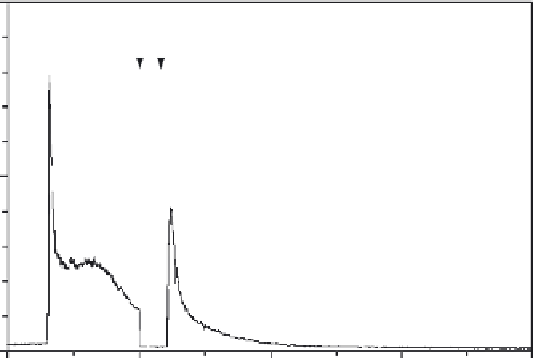
Fig. 11
Procedure for in situ calibration of intracellular Fura-2. (A) Fluorescence intensity traces
acquired at 340- and 380-nm excitation. Time marker arrow correspond to (1) addition of 50 nM
vasopressin; (2) exchange into Ca
2
þ
-free phosphate-bu
V
ered saline (PBS) containing 10 mM MgCl
2
,
2 mM EGTA, pH 7.4; (3) addition of 10
m
M ionomycin; (4) exchange into nominally Ca
2
þ
-free saline,
pH 7.4; (5) addition of 10
m
M ionomycin
þ
20 mM CaCl
2
; and (6) 20
m
M digitonin. Dotted lines mark
fluorescence levels corresponding to various parameters discussed in
Section V.B
. (a.u. = arbitrary
units). (B) F
340
/F
380
ratio trace derived from the data in (A). Dotted lines mark R
min
and R
max
(0.566 and
16.6, respectively, in this experiment). The parameter s
f,2
/s
b,2
is 10.7. Inset. The portion of the trace from
20 to 118 min at higher resolution on the vertical scale to reveal the gradualness with which R
min
is
approached. (C) [Ca
2
þ
]
i
trace derived from the ratio trace by using
Eq. (2)
in
Section V.B
. Only the first
40 min of the experiment are shown. This REF52 cell was incubated with 1
m
M Fura-2 AM in Pluronic
dispersion in HBSS for 90 min at 25
C before being transferred to fresh HBSS for measurement.
Elevation of [Ca
2
þ
]
i
by ionophore can lead to rapid cell lysis and loss of indica-
tor, sometimes before R
max
can be determined confidently. Almost paradoxically,
raising the extracellular [Ca
2
þ
] to 10-30 mM (rather than just a few mM) in this
procedure appears, in some cases, to have a protective e
ect on cell structure so
lysis is deferred and R
max
can be reached. If high extracellular [Ca
2
þ
] is used, the
medium should be free of phosphate salts, bicarbonate/carbonate, and even sul-
fate, since these ions can form precipitates with Ca
2
þ
.
Typical data from an experiment performed on a REF52 cell loaded with Fura-
2 are shown in
Fig. 11
. Shown in
Fig. 11
A are the two raw data traces, F
0
340
and
F
0
380
, collected when the cell is excited alternately with 340-nm and 380-nm light.
The fluorescence signals measured after digitonin permeabilization are the back-
ground intensities, BG
340
and BG
380
, that must be subtracted from the respective
traces
V
to yield the
true
F
340
and
F
380
(i.e.,
F
340
¼
F
0
340
BG
340
and
F
380
¼
F
0
380
BG
380
). The ratio trace is
simply a point-by-point division,