Biology Reference
In-Depth Information
Ca
2+
-bound
Ca
2+
-free
420
440
460
Wavelength (nm)
480
500
520
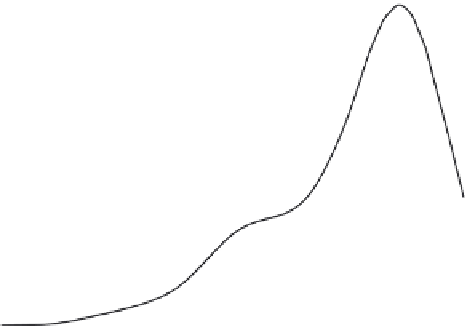
Fig. 2
Excitation spectra for Fluo-3 (
l
emission
¼
525 nm). The Ca
2
þ
-free form of Fluo-3 is
100 times
less bright than the Ca
2
þ
-bound form.
Ca
2+
-bound
Ca
2+
-free
300
350
400
450
Wavelength (nm)
Fig. 3
Excitation spectra of Ca
2
þ
-bound and Ca
2
þ
-free forms of Fura-2 (
l
emission
¼
505 nm).
of the indicator actually have distinct spectra, the maxima in which occur at
di
erent wavelengths (the spectra show wavelength shifts). The two ratiometric
indicators most commonly used are Fura-2 and Indo-1 (
Grynkiewicz et al., 1985
).
For Fura-2, significant shifts are observed in the excitation spectra (
Fig. 3
) but not
in the emission spectra. Indo-1 shows a significant shift primarily in its emission
spectra. For nonratiometric indicators, because intensity monitored at a single-
V